
The Macro Picture 🗺️
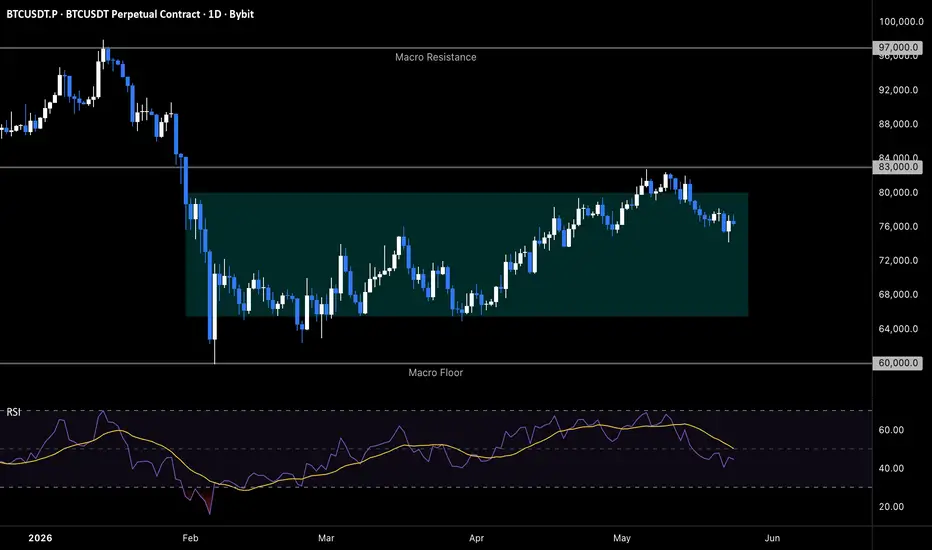
Bitcoin has been carving out a wide structural reset between the $97,000 macro ceiling and the $60,000 macro floor — a four-month accumulation pocket that desperately needs to be tested in both directions before the next directional leg can resolve. The green zone marked on the chart between $66,000 and $80,000 is a volatility playground where bulls and bears have been trading control without conviction. Price now sits at $77,000 after a clean rejection at the $83,000 local high, signaling that the upper boundary of the recovery channel has done its job.
The Setup ⚙️
The Ceiling: The $83,000 zone marked the structural peak of the recovery leg from February's flush, and bears are defending it with conviction — RSI rolling off 60 confirms the momentum exhaustion on this local push.
The Range Play: The zone between $66,000 and $80,000 creates a structural playground for grid-based accumulation, where systematic oscillation between range boundaries becomes the path of least resistance until either macro level breaks.
The Reaction: Bulls are now defending $76,000 as the first reactive layer — losing this support opens a clean route toward the mid-range pocket where deeper demand sits stacked from March's base-building sequence.
The Roadmap: Primary target sits at $72,000 — the mid-range equilibrium where prior consolidation built the foundation for April's recovery leg. Invalidation: a sustained 2D close above $83,000 would invalidate this bearish thesis and trigger a renewed push toward the $88,000 macro ceiling.
Bitcoin has been carving out a wide structural reset between the $97,000 macro ceiling and the $60,000 macro floor — a four-month accumulation pocket that desperately needs to be tested in both directions before the next directional leg can resolve. The green zone marked on the chart between $66,000 and $80,000 is a volatility playground where bulls and bears have been trading control without conviction. Price now sits at $77,000 after a clean rejection at the $83,000 local high, signaling that the upper boundary of the recovery channel has done its job.
The Setup ⚙️
The Ceiling: The $83,000 zone marked the structural peak of the recovery leg from February's flush, and bears are defending it with conviction — RSI rolling off 60 confirms the momentum exhaustion on this local push.
The Range Play: The zone between $66,000 and $80,000 creates a structural playground for grid-based accumulation, where systematic oscillation between range boundaries becomes the path of least resistance until either macro level breaks.
The Reaction: Bulls are now defending $76,000 as the first reactive layer — losing this support opens a clean route toward the mid-range pocket where deeper demand sits stacked from March's base-building sequence.
The Roadmap: Primary target sits at $72,000 — the mid-range equilibrium where prior consolidation built the foundation for April's recovery leg. Invalidation: a sustained 2D close above $83,000 would invalidate this bearish thesis and trigger a renewed push toward the $88,000 macro ceiling.

📈 Stop guessing your settings — backtest & optimize with QuantPilot
🎁 Free to start
🎁 Free to start
Wyłączenie odpowiedzialności
Informacje i publikacje nie stanowią i nie powinny być traktowane jako porady finansowe, inwestycyjne, tradingowe ani jakiekolwiek inne rekomendacje dostarczane lub zatwierdzone przez TradingView. Więcej informacji znajduje się w Warunkach użytkowania.
📈 Stop guessing your settings — backtest & optimize with QuantPilot
🎁 Free to start
🎁 Free to start
Wyłączenie odpowiedzialności
Informacje i publikacje nie stanowią i nie powinny być traktowane jako porady finansowe, inwestycyjne, tradingowe ani jakiekolwiek inne rekomendacje dostarczane lub zatwierdzone przez TradingView. Więcej informacji znajduje się w Warunkach użytkowania.