
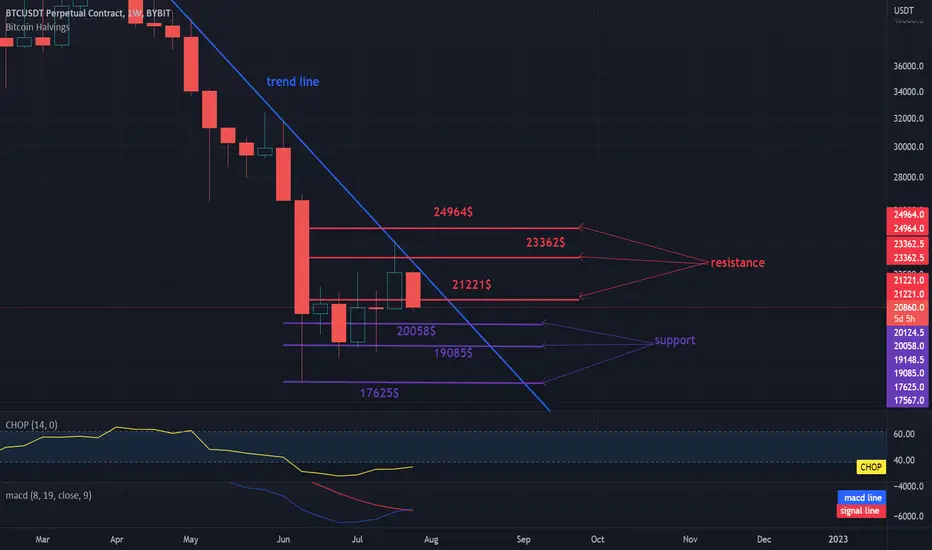
Hello everyone, let's take a look at the BTC to USDT chart over the weekend 1 timeframe. As you can see, the price stays below the downtrend line.
Let's start with the designation of the support line and as you can see the first support in the near future is $ 20,508, if the support breaks down, the next support is $ 19,085 and $ 17,625.
Now let's move from the resistance line as you can see the first resistance is $ 21,221, if you can break it the next resistance will be $ 23,362 and $ 24,964.
Looking at the CHOP indicator, we can see that on the weekend interval 1 the energy slowly starts to rise, and the MACD indicator indicates a possible change of the trend into an upward trend.

Wyłączenie odpowiedzialności
Informacje i publikacje nie stanowią i nie powinny być traktowane jako porady finansowe, inwestycyjne, tradingowe ani jakiekolwiek inne rekomendacje dostarczane lub zatwierdzone przez TradingView. Więcej informacji znajduje się w Warunkach użytkowania.
Wyłączenie odpowiedzialności
Informacje i publikacje nie stanowią i nie powinny być traktowane jako porady finansowe, inwestycyjne, tradingowe ani jakiekolwiek inne rekomendacje dostarczane lub zatwierdzone przez TradingView. Więcej informacji znajduje się w Warunkach użytkowania.