
Trader’s Mindset: The First Fundamental Stone & Key Observations
Trader’s Mindset: The First Fundamental Stone of the Market
Stop asking, “How much profit did I make?”
Start asking, “What is my winning probability?”
📊 In trading, consistency beats randomness.
It’s not about one big win — it’s about repeating a high-probability edge again and again.
💭 Smart traders don’t chase money…
They focus on accuracy, discipline, and data-backed decisions.
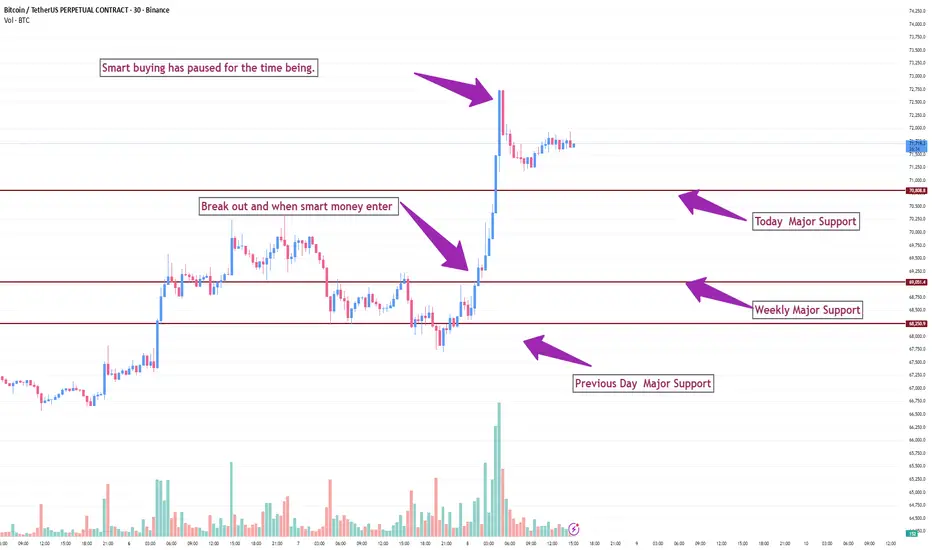
TradingView chart for the Bitcoin/Tether Perpetual Contract (30m timeframe, April 8, 2026), .
Key Observations:
Sequential Breakouts: The move originated with a breakout above the 'Weekly Major Support' level (approx. $69,400). This was followed by a subsequent breakout with significant volume above 'Today’s Major Support' (approx. $71,800), labelled as an entry by "smart money."
Current State: Following this surge, upward momentum has slowed ("Smart buying has paused"). Price is currently in a technical pullback, retesting the 'Today’s Major Support' level.
Support Structure: The chart identifies three distinct support levels: Today's ($71,800), Weekly ($69,400), and Previous Day ($68,200).
Stop asking, “How much profit did I make?”
Start asking, “What is my winning probability?”
📊 In trading, consistency beats randomness.
It’s not about one big win — it’s about repeating a high-probability edge again and again.
💭 Smart traders don’t chase money…
They focus on accuracy, discipline, and data-backed decisions.
TradingView chart for the Bitcoin/Tether Perpetual Contract (30m timeframe, April 8, 2026), .
Key Observations:
Sequential Breakouts: The move originated with a breakout above the 'Weekly Major Support' level (approx. $69,400). This was followed by a subsequent breakout with significant volume above 'Today’s Major Support' (approx. $71,800), labelled as an entry by "smart money."
Current State: Following this surge, upward momentum has slowed ("Smart buying has paused"). Price is currently in a technical pullback, retesting the 'Today’s Major Support' level.
Support Structure: The chart identifies three distinct support levels: Today's ($71,800), Weekly ($69,400), and Previous Day ($68,200).

Wyłączenie odpowiedzialności
Informacje i publikacje nie stanowią i nie powinny być traktowane jako porady finansowe, inwestycyjne, tradingowe ani jakiekolwiek inne rekomendacje dostarczane lub zatwierdzone przez TradingView. Więcej informacji znajduje się w Warunkach użytkowania.
Wyłączenie odpowiedzialności
Informacje i publikacje nie stanowią i nie powinny być traktowane jako porady finansowe, inwestycyjne, tradingowe ani jakiekolwiek inne rekomendacje dostarczane lub zatwierdzone przez TradingView. Więcej informacji znajduje się w Warunkach użytkowania.