
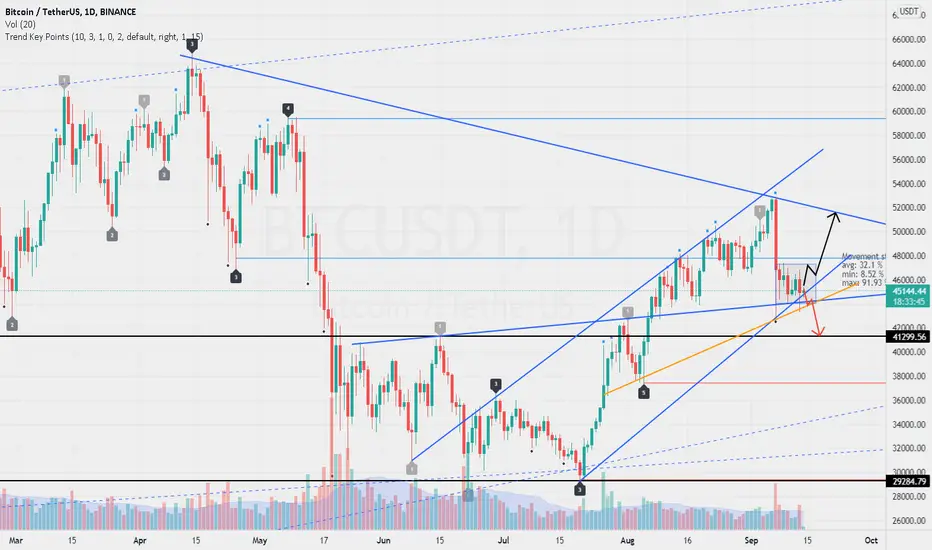
$44k is the most important support near. Its breakdown could pull the price around $41k.
The rectangle is drawn on the 1-hour time frame, I expect it to break upwards with a resistance. If so, the next stop will be between $50k and $51k.
Trend Key Points Indicator have been used to draw important key levels and key points.
The rectangle is drawn on the 1-hour time frame, I expect it to break upwards with a resistance. If so, the next stop will be between $50k and $51k.
Trend Key Points Indicator have been used to draw important key levels and key points.

Powiązane publikacje
Wyłączenie odpowiedzialności
Informacje i publikacje nie stanowią i nie powinny być traktowane jako porady finansowe, inwestycyjne, tradingowe ani jakiekolwiek inne rekomendacje dostarczane lub zatwierdzone przez TradingView. Więcej informacji znajduje się w Warunkach użytkowania.
Powiązane publikacje
Wyłączenie odpowiedzialności
Informacje i publikacje nie stanowią i nie powinny być traktowane jako porady finansowe, inwestycyjne, tradingowe ani jakiekolwiek inne rekomendacje dostarczane lub zatwierdzone przez TradingView. Więcej informacji znajduje się w Warunkach użytkowania.