
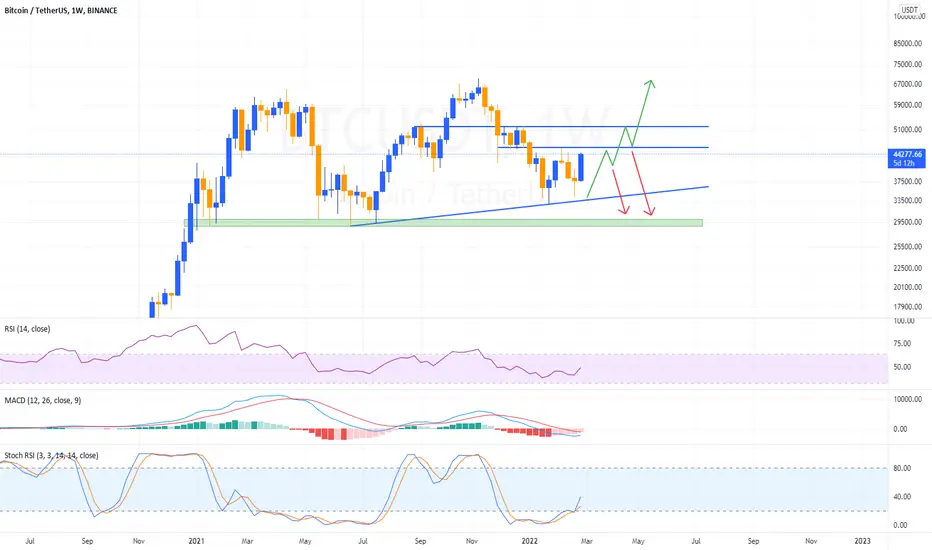
Bitcoin has been showing big volatility last two month becuase of FED interest speculation and Russia vs Ukraine crisis. But weekly chart still bullish and indicates BTC can have a big rally in next 12-16 weeks. RSI showing bullish divergence, MACD showing low sell pressure like June 20221 and stock RSI indicate market can give bounce with short term noise.
First resistance on W1 chart is $45k then $53k while support is at $36k and $29k.
Try to understand chart and trade between the lines.
Major events: Russia/Ukraine and FED interest speculation.
Trade safely :)
First resistance on W1 chart is $45k then $53k while support is at $36k and $29k.
Try to understand chart and trade between the lines.
Major events: Russia/Ukraine and FED interest speculation.
Trade safely :)

Wyłączenie odpowiedzialności
Informacje i publikacje nie stanowią i nie powinny być traktowane jako porady finansowe, inwestycyjne, tradingowe ani jakiekolwiek inne rekomendacje dostarczane lub zatwierdzone przez TradingView. Więcej informacji znajduje się w Warunkach użytkowania.
Wyłączenie odpowiedzialności
Informacje i publikacje nie stanowią i nie powinny być traktowane jako porady finansowe, inwestycyjne, tradingowe ani jakiekolwiek inne rekomendacje dostarczane lub zatwierdzone przez TradingView. Więcej informacji znajduje się w Warunkach użytkowania.