
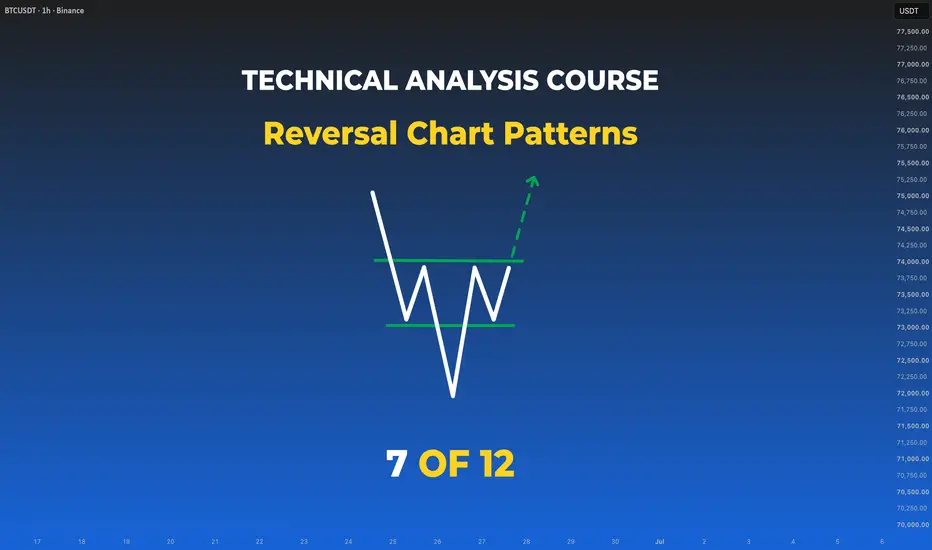
Lesson 7 - Reversal Chart Patterns: How Trends End
Difficulty: (Beginner–Intermediate)
Many major trend reversals leave recognizable structures on the chart — shapes that professionals have been reading for a century. Head & Shoulders, Double Tops, Triple Tops, and Rounding patterns are the classical reversal formations. Learn to recognize them early, and you can prepare for possible trend changes with more structure.

🔵 RECAP — WHERE WE LEFT OFF
In Lesson 6, you learned multi-candle reversal patterns — Engulfing, Stars, Three Soldiers. Those are small, precise signals. Now we zoom out to the big structural shapes that unfold over weeks or months and often mark the end of entire trends.
🔵 WHY CHART PATTERNS MATTER MORE THAN CANDLES
A candle pattern shows a moment. A chart pattern shows a shift in market psychology over time.
When a trend has run for months, the market rarely reverses in one candle. It often builds a shape — usually 3 or more swings — that can signal distribution or accumulation is happening. That shape is your early warning.
🐳 Pro Tip: A weekly Head & Shoulders can signal a larger shift than the same pattern on a 5-minute chart. The bigger the timeframe, the more meaningful the potential move.
🔵 1. HEAD & SHOULDERS — THE KING OF REVERSALS
One of the most widely followed reversal patterns in classical TA.

Structure (bearish reversal at trend top):
Confirmation: pattern completes when price closes below the neckline.
Target: measure the distance from the top of the head to the neckline. Project that same distance downward from the neckline break.
Inverted Head & Shoulders — same structure mirrored, at the bottom of a downtrend. Bullish reversal.
🐳 Pro Tip: The right shoulder should typically stay below the head. If it makes a new high, the pattern is often invalidated.
🔵 2. DOUBLE TOP & DOUBLE BOTTOM
Two failed attempts at the same extreme. Simple, common, and widely used.

Double Top (Bearish Reversal): price rallies to a high, pulls back, rallies to the same high, and fails again. The pullback low between the two peaks is the neckline.
Double Bottom (Bullish Reversal): mirror image at a support level.
Confirmation: pattern completes when price closes beyond the neckline.
Target: measure the distance from the peak (or trough) to the neckline. Project that distance beyond the break.
🐳 Pro Tip: The two peaks (or bottoms) should be near-identical in price. If the second one is significantly higher/lower, it may not be a Double Top — the trend could still be continuing.
🔵 3. TRIPLE TOP & TRIPLE BOTTOM
Three failed attempts instead of two. Rarer than doubles, but often carry more weight when they appear.
Structure and target measurement follow the same logic as Double Tops/Bottoms — just one more rejection at the level.
🐳 Pro Tip: A Triple Top can sometimes convert into a Descending Triangle (which you'll see in Lesson 8 on Continuation Patterns) if it breaks the neckline hard.
🔵 4. ROUNDING TOP & ROUNDING BOTTOM
The slowest, quietest reversal pattern — and often the cleanest when confirmed.

Rounding Bottom (Bullish, aka "Saucer"): a smooth, arc-shaped bottom. Sellers slowly lose control, buyers slowly take over. When the pattern completes and breaks the neckline, the ensuing rally can be powerful.
Rounding Top: mirror image at a market top. Slow distribution, then a decisive break down.
🐳 Pro Tip: Rounding patterns are often overlooked because they take time to form, but they can provide cleaner structural context when confirmed.
🔵 5. HOW TO TRADE ANY REVERSAL PATTERN

The universal 4-step process:
Entry styles:
Stop loss: just beyond the pattern's extreme (below the head in this Inverted H&S example).
Reward zone: once the breakout is confirmed, price can run well beyond the neckline — the chart above shows a real Inverted H&S at the 2022 BTC bottom, where the valid breakout above the neckline was followed by a multi-month rally.
🔵 6. COMMON BEGINNER MISTAKES
🔵 7. YOUR REVERSAL PATTERN FRAMEWORK
Before acting on any reversal pattern, ask:
🔵 QUICK SELF-CHECK
🔵 WHAT IS NEXT
Lesson 8 — Continuation Chart Patterns: reversal patterns can mark the end of trends. Continuation patterns can help traders structure trend-following entries with clearer context. We will cover Flags, Pennants, Triangles (Symmetric / Ascending / Descending), Rectangles, and Wedges.
Drop a comment: which reversal pattern do you find easiest to identify — Head & Shoulders, Double Top, or Rounding?
Full Trading Roadmap | Classical TA Course
Trading Roadmap | Classical TA · Lesson 01 — Mastering the Chart
Trading Roadmap | Classical TA · Lesson 02 — Mastering Trends
Trading Roadmap | Classical TA · Lesson 03 — Support & Resistance
Trading Roadmap | Classical TA · Lesson 04 — Price Channels
Trading Roadmap | Classical TA · Lesson 05 — Single Candle Patterns
Trading Roadmap | Classical TA · Lesson 06 — Multi-Candle Patterns
Best Regards, BigBeluga 🐳
Difficulty: (Beginner–Intermediate)
Many major trend reversals leave recognizable structures on the chart — shapes that professionals have been reading for a century. Head & Shoulders, Double Tops, Triple Tops, and Rounding patterns are the classical reversal formations. Learn to recognize them early, and you can prepare for possible trend changes with more structure.
🔵 RECAP — WHERE WE LEFT OFF
In Lesson 6, you learned multi-candle reversal patterns — Engulfing, Stars, Three Soldiers. Those are small, precise signals. Now we zoom out to the big structural shapes that unfold over weeks or months and often mark the end of entire trends.
🔵 WHY CHART PATTERNS MATTER MORE THAN CANDLES
A candle pattern shows a moment. A chart pattern shows a shift in market psychology over time.
When a trend has run for months, the market rarely reverses in one candle. It often builds a shape — usually 3 or more swings — that can signal distribution or accumulation is happening. That shape is your early warning.
🐳 Pro Tip: A weekly Head & Shoulders can signal a larger shift than the same pattern on a 5-minute chart. The bigger the timeframe, the more meaningful the potential move.
🔵 1. HEAD & SHOULDERS — THE KING OF REVERSALS
One of the most widely followed reversal patterns in classical TA.
Structure (bearish reversal at trend top):
- Left Shoulder — a peak followed by a pullback
- Head — a higher peak (the highest of the three)
- Right Shoulder — a lower peak roughly at the level of the left shoulder
- Neckline — the line connecting the two pullback lows between the peaks
Confirmation: pattern completes when price closes below the neckline.
Target: measure the distance from the top of the head to the neckline. Project that same distance downward from the neckline break.
Inverted Head & Shoulders — same structure mirrored, at the bottom of a downtrend. Bullish reversal.
🐳 Pro Tip: The right shoulder should typically stay below the head. If it makes a new high, the pattern is often invalidated.
🔵 2. DOUBLE TOP & DOUBLE BOTTOM
Two failed attempts at the same extreme. Simple, common, and widely used.
Double Top (Bearish Reversal): price rallies to a high, pulls back, rallies to the same high, and fails again. The pullback low between the two peaks is the neckline.
Double Bottom (Bullish Reversal): mirror image at a support level.
Confirmation: pattern completes when price closes beyond the neckline.
Target: measure the distance from the peak (or trough) to the neckline. Project that distance beyond the break.
🐳 Pro Tip: The two peaks (or bottoms) should be near-identical in price. If the second one is significantly higher/lower, it may not be a Double Top — the trend could still be continuing.
🔵 3. TRIPLE TOP & TRIPLE BOTTOM
Three failed attempts instead of two. Rarer than doubles, but often carry more weight when they appear.
Structure and target measurement follow the same logic as Double Tops/Bottoms — just one more rejection at the level.
🐳 Pro Tip: A Triple Top can sometimes convert into a Descending Triangle (which you'll see in Lesson 8 on Continuation Patterns) if it breaks the neckline hard.
🔵 4. ROUNDING TOP & ROUNDING BOTTOM
The slowest, quietest reversal pattern — and often the cleanest when confirmed.
Rounding Bottom (Bullish, aka "Saucer"): a smooth, arc-shaped bottom. Sellers slowly lose control, buyers slowly take over. When the pattern completes and breaks the neckline, the ensuing rally can be powerful.
Rounding Top: mirror image at a market top. Slow distribution, then a decisive break down.
🐳 Pro Tip: Rounding patterns are often overlooked because they take time to form, but they can provide cleaner structural context when confirmed.
🔵 5. HOW TO TRADE ANY REVERSAL PATTERN
The universal 4-step process:
- Identify the pattern as it develops — after the head forms (for H&S), or after the second peak/trough (for Doubles)
- Draw the neckline connecting the reaction points
- Wait for a close beyond the neckline — the pattern is not confirmed until then
- Choose your entry style — see below
Entry styles:
- Aggressive traders may enter on a decisive close beyond the neckline.
- Conservative traders often wait for a retest of the neckline before entering.
Stop loss: just beyond the pattern's extreme (below the head in this Inverted H&S example).
Reward zone: once the breakout is confirmed, price can run well beyond the neckline — the chart above shows a real Inverted H&S at the 2022 BTC bottom, where the valid breakout above the neckline was followed by a multi-month rally.
🔵 6. COMMON BEGINNER MISTAKES
- Trading the pattern before the neckline breaks (anticipation)
- Ignoring the higher-timeframe trend — a bearish reversal pattern inside a stronger uptrend can often fail
- Confusing a Double Top with a healthy pullback in an uptrend
- Not measuring the target and holding trades without a plan
- Trading small chart patterns on 1m or 5m — they can be less reliable there
- Entering without deciding whether you're playing the break or the retest
🔵 7. YOUR REVERSAL PATTERN FRAMEWORK
Before acting on any reversal pattern, ask:
- Is the pattern at the end of an extended trend?
- Has the neckline been broken with a body close and follow-through?
- Where is the projected target — and does it justify the risk?
- Does the higher timeframe agree with the reversal?
🔵 QUICK SELF-CHECK
- Identify a Head & Shoulders vs an Inverted H&S
- Draw a neckline on any Double Top or Bottom
- Measure a target from the pattern's height
- Explain why Rounding patterns take longer but can produce cleaner structural moves
- Choose your entry style — break vs retest — and defend the choice
🔵 WHAT IS NEXT
Lesson 8 — Continuation Chart Patterns: reversal patterns can mark the end of trends. Continuation patterns can help traders structure trend-following entries with clearer context. We will cover Flags, Pennants, Triangles (Symmetric / Ascending / Descending), Rectangles, and Wedges.
Drop a comment: which reversal pattern do you find easiest to identify — Head & Shoulders, Double Top, or Rounding?
Full Trading Roadmap | Classical TA Course
Trading Roadmap | Classical TA · Lesson 01 — Mastering the Chart
Trading Roadmap | Classical TA · Lesson 02 — Mastering Trends
Trading Roadmap | Classical TA · Lesson 03 — Support & Resistance
Trading Roadmap | Classical TA · Lesson 04 — Price Channels
Trading Roadmap | Classical TA · Lesson 05 — Single Candle Patterns
Trading Roadmap | Classical TA · Lesson 06 — Multi-Candle Patterns
Best Regards, BigBeluga 🐳

🌐 bigbeluga.org/tv - Get access to our powerful tools & indicators.
🔵 Learn More -> docs.bigbeluga.org/
🔵 Join Discord -> go.bigbeluga.org/k65q9bfqfu
All content provided by BigBeluga is for educational purposes only
🔵 Learn More -> docs.bigbeluga.org/
🔵 Join Discord -> go.bigbeluga.org/k65q9bfqfu
All content provided by BigBeluga is for educational purposes only
Powiązane publikacje
Wyłączenie odpowiedzialności
Informacje i publikacje nie stanowią i nie powinny być traktowane jako porady finansowe, inwestycyjne, tradingowe ani jakiekolwiek inne rekomendacje dostarczane lub zatwierdzone przez TradingView. Więcej informacji znajduje się w Warunkach użytkowania.