
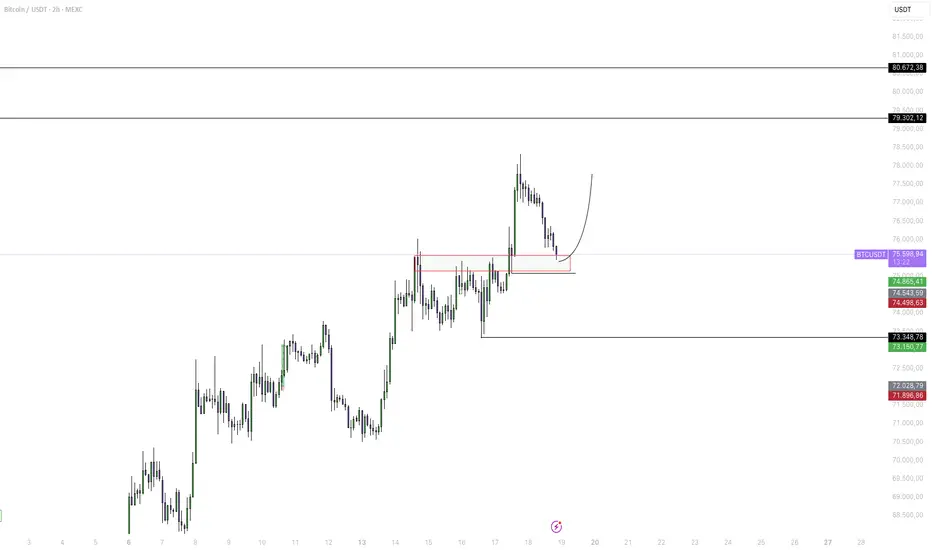
📊 BTC/USDT Analysis - 2H Timeframe
The Bitcoin chart shows a decidedly interesting setup after the recent bullish push. Here are the key points to monitor:
🔍 Current Situation
Price Action: After touching a local high around $78,500, the price has entered a natural correction phase.
Support Zone (Red Box): BTC is currently retesting a critical demand zone between $74,800 and $75,500. This area, previously a tough resistance, is now acting as support (S/R flip).
Structure: As long as we hold the low marked at $73,348, the 2H structural trend remains firmly bullish.
🎯 Key Levels
Immediate Support: $75,000 (Psychological Area + Red Box).
Resistance 1: $78,500 (Recent High).
Bullish Targets: If support holds, the next chart targets are $79,300 and then the $80,600 area.
💡 Trading Scenario
The chart indication (the curved arrow) suggests a possible rebound from the current area. A signal of strength (such as a hammer candlestick or volume absorption) in this red box could confirm a rebound toward new highs.
The Bitcoin chart shows a decidedly interesting setup after the recent bullish push. Here are the key points to monitor:
🔍 Current Situation
Price Action: After touching a local high around $78,500, the price has entered a natural correction phase.
Support Zone (Red Box): BTC is currently retesting a critical demand zone between $74,800 and $75,500. This area, previously a tough resistance, is now acting as support (S/R flip).
Structure: As long as we hold the low marked at $73,348, the 2H structural trend remains firmly bullish.
🎯 Key Levels
Immediate Support: $75,000 (Psychological Area + Red Box).
Resistance 1: $78,500 (Recent High).
Bullish Targets: If support holds, the next chart targets are $79,300 and then the $80,600 area.
💡 Trading Scenario
The chart indication (the curved arrow) suggests a possible rebound from the current area. A signal of strength (such as a hammer candlestick or volume absorption) in this red box could confirm a rebound toward new highs.

Wyłączenie odpowiedzialności
Informacje i publikacje nie stanowią i nie powinny być traktowane jako porady finansowe, inwestycyjne, tradingowe ani jakiekolwiek inne rekomendacje dostarczane lub zatwierdzone przez TradingView. Więcej informacji znajduje się w Warunkach użytkowania.
Wyłączenie odpowiedzialności
Informacje i publikacje nie stanowią i nie powinny być traktowane jako porady finansowe, inwestycyjne, tradingowe ani jakiekolwiek inne rekomendacje dostarczane lub zatwierdzone przez TradingView. Więcej informacji znajduje się w Warunkach użytkowania.