
Hi traders and investors!
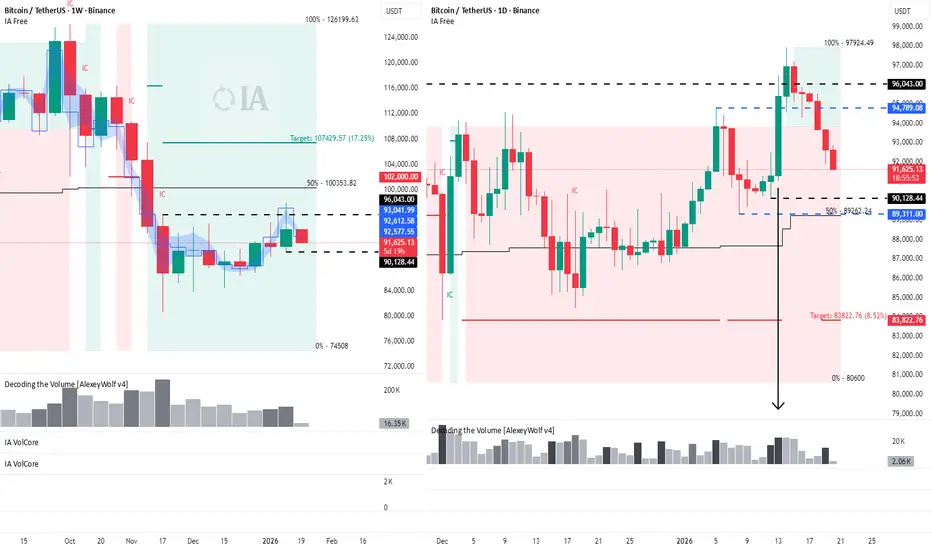
The last weekly buyer candle has formed on increased volume, with the main volume accumulation occurring essentially around 96,043. As long as the price fails to hold above this level, it confirms that sellers continue to defend it.
On the daily timeframe, it is worth paying attention to the January 13 candle: it also formed on elevated volume and showed a very strong delta, meaning buying activity dominated. However, this activity may turn out to be a bull trap if the market fails to develop further upside.
Key support levels for buyers at the moment are:
90,128 — a weekly level,
89,311 and 89,262 — daily levels.
If these levels fail to hold the price, the probability of a decline toward 83,822 increases — this is the seller’s target within its initiative inside the range. A further move toward a retest of the local low around 80,600 cannot be ruled out.
Profitable trades!
This analysis is based on the Initiative Analysis (IA) method.
The last weekly buyer candle has formed on increased volume, with the main volume accumulation occurring essentially around 96,043. As long as the price fails to hold above this level, it confirms that sellers continue to defend it.
On the daily timeframe, it is worth paying attention to the January 13 candle: it also formed on elevated volume and showed a very strong delta, meaning buying activity dominated. However, this activity may turn out to be a bull trap if the market fails to develop further upside.
Key support levels for buyers at the moment are:
90,128 — a weekly level,
89,311 and 89,262 — daily levels.
If these levels fail to hold the price, the probability of a decline toward 83,822 increases — this is the seller’s target within its initiative inside the range. A further move toward a retest of the local low around 80,600 cannot be ruled out.
Profitable trades!
This analysis is based on the Initiative Analysis (IA) method.
Uwaga
The price has reached the first target at 83,822.
The next target is the lower boundary of the daily range at 80,600.
So far, there are no signs of a reversal on the chart.

Clarity on the Chart. Smart Trading Decisions
Wyłączenie odpowiedzialności
Informacje i publikacje nie stanowią i nie powinny być traktowane jako porady finansowe, inwestycyjne, tradingowe ani jakiekolwiek inne rekomendacje dostarczane lub zatwierdzone przez TradingView. Więcej informacji znajduje się w Warunkach użytkowania.
Clarity on the Chart. Smart Trading Decisions
Wyłączenie odpowiedzialności
Informacje i publikacje nie stanowią i nie powinny być traktowane jako porady finansowe, inwestycyjne, tradingowe ani jakiekolwiek inne rekomendacje dostarczane lub zatwierdzone przez TradingView. Więcej informacji znajduje się w Warunkach użytkowania.