
Hello?
Nice to meet you, fellow traders.
If you "follow" me, you can always get new information quickly.
Have a great day.
------------------------------------
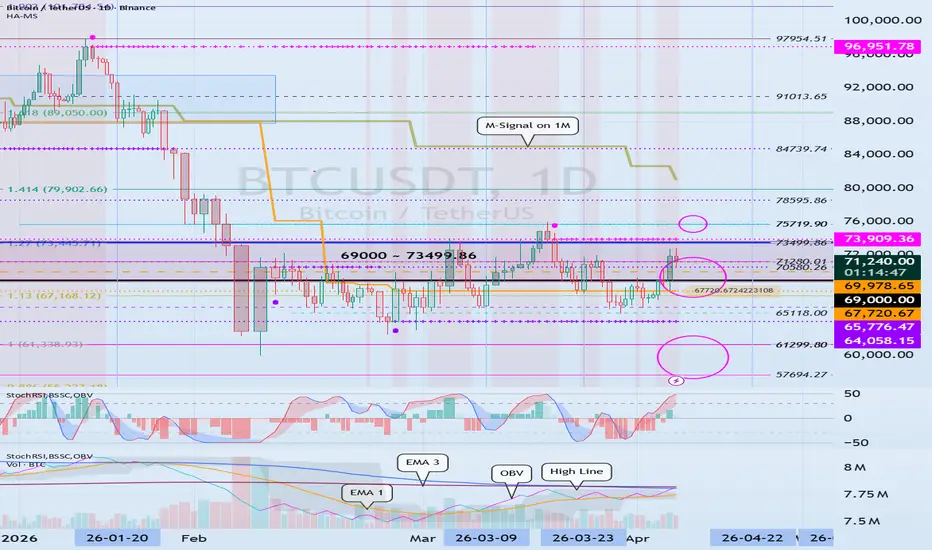
As the price rises, the HA-Low indicator on the 1W chart is showing signs of forming at the 69978.65 point.
Accordingly, the key question is whether it can find support and rise in the range of 69978.65 to 71058.26.
However, since the StochRSI indicator is in the overbought zone and the OBV indicator is located near the EMA 3 line, there is a possibility that the upward movement will be constrained.
Therefore, we must verify whether it can find support around the 67720.67 to 71058.26 range.
The next period of volatility is around April 22nd.
-
Looking at the 15-minute chart, the channel formed by the OBV indicator's Low Line to High Line is in a contracted state, so it is highly likely that volatility will occur soon.
At that time, we need to observe which direction it moves relative to the 69978.65 to 71058.26 range.
------------------------
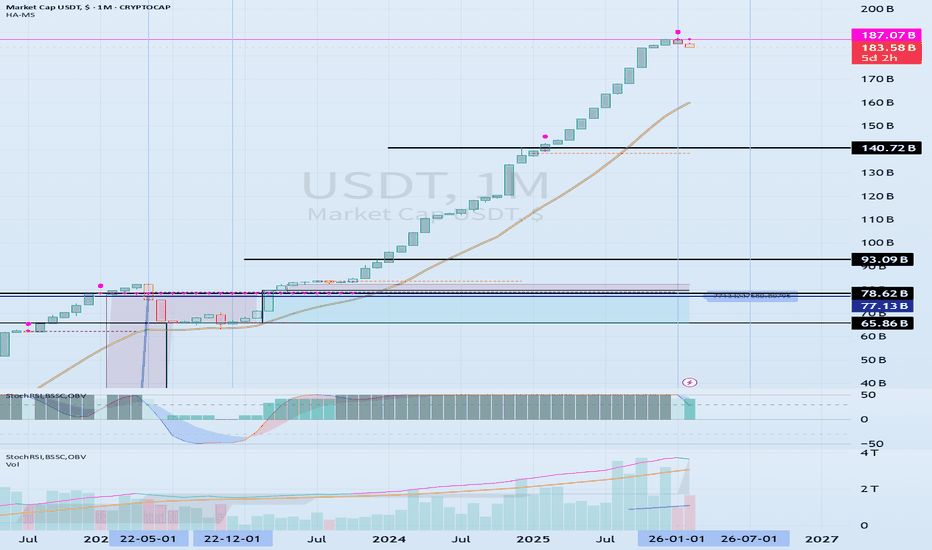
For prices to rise, at the very least, there must be no outflow of funds from the cryptocurrency market.
Currently, USDT is consolidating, while USDC is showing a gap-up.
Accordingly, this indicates that funds are flowing in through USDC.
-
Since the current BTC price has fallen by approximately -50%,
I believe that BTC dominance should rise and USDT dominance should fall.
Therefore, from a chart analysis perspective, I believe it needs to show a strong upward breakout of the 69,000 ~ 73,499.86 range.
Since a full-scale uptrend is highly likely to begin when the price rises above the M-Signal indicator on the 1M chart, you should monitor the movement when the M-Signal indicator falls to the 69,000–73,499.86 range.
Because the DOM (-60) or HA-Low indicators, which signal a bottom, are not appearing despite the price decline, you should anticipate a possibility of further drops and prepare a response strategy.
Therefore, based on the current price position, the maximum decline is expected to occur around the 57,694.27–61,299.80 range.
-
Looking at the StochRSI indicators on each chart,
the 1M chart is located in the oversold zone, while the 1W and 1D charts are located in the overbought zone.
Therefore, in the event of a price decline, the key factor is expected to be whether support is maintained around the DOM (-60) indicator range of 64,058.15 to 65,776.47.
----------------------------------
Since the current period is a buying time, caution is required when selling.
As mentioned below, a full-scale uptrend is highly likely to begin in July, so a trading strategy must be developed accordingly.
-
Thank you for reading to the end.
I wish you successful trading.
--------------------------------------------------
(The coin market is expected to start its uptrend in July)
-
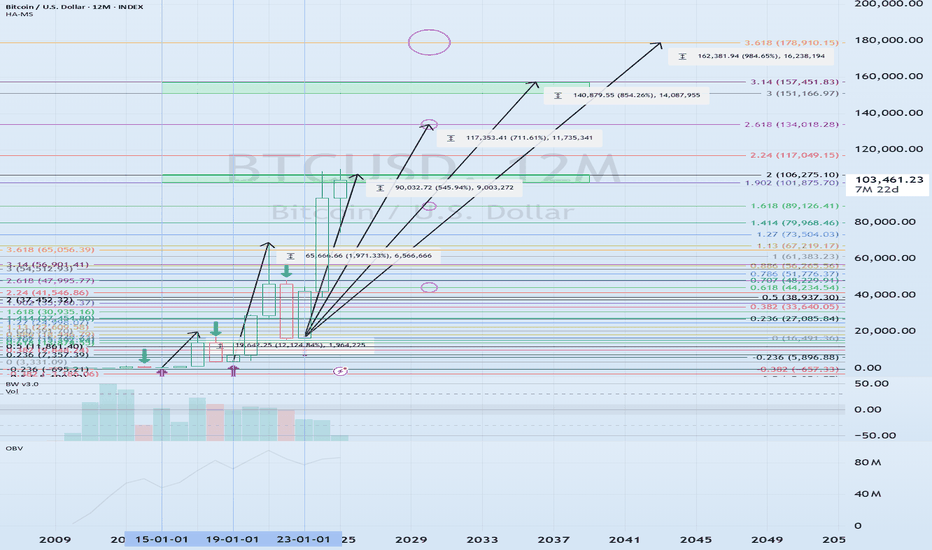
- This is an explanation of the big picture.
(3-year bull market, 1-year bear market pattern)
------------------------------------------------------
Uwaga
USDT has experienced a significant gap up for the first time since March.
I believe that a gap up in USDT or USDC signifies that funds have flowed into the coin market.
Uwaga
Looking at the charts for BTC and ETH, the StochRSI indicator is showing signs of declining from the overbought zone.
However, we need to observe how the StochRSI indicator behaves when a new candle is formed as the price rises.
We need to watch whether BTCUSDT breaks above the 73,909.36–75,719.90 range, and whether ETHUSDT breaks above the 2,317.39 point.
If they fail to rise, there is a possibility of a short-term downtrend, so it is expected that some selling may be possible to secure the number of coins corresponding to profits.
However, since the duration of the short-term downtrend may be brief, I believe it is advisable to set a stop-loss at -0.4% or higher at the selling point or to buy back quickly.
Zlecenie aktywne
#BTCUSDTIf the price maintains above 75719.90, which is the StochRSI 20 indicator point on the 1M chart, it is likely to lead to an upward movement that will push it above the M-Signal indicator on the 1M chart.
Therefore, when the price shows signs of support around 75,719.90, you must observe the following:
- The StochRSI indicator falls from the overbought zone and resumes an upward trend;
- The OBV indicator maintains above EMA 3, confirming whether the channel formed by the Low Line to the High Line continues as an upward channel; and
- The BSSC indicator maintains above the 0 point.
Since the StochRSI indicator is currently in the overbought zone, there is a possibility that the upward movement will be constrained.
However, if the OBV indicator maintains above the High Line, there is a possibility of a forced upward trend driven by buying pressure; therefore, caution is required, as blindly following the price could result in buying at a short-term peak.
Consequently, the buying timing corresponds to when the price satisfies the above conditions and shows signs of support around 75,719.90.
The final buying timing is when the price shows signs of support near the M-Signal indicator on the 1M chart.

YouTube: youtube.com/@readcrypto9837
※ Follow X to check out the posts.
※ X를 팔로우하고 게시물을 확인하세요.
◆ t.me/readCryptoChannel
[HA-MS Indicator]
bit.ly/3YxHgvN
[OBV Indicator]
bit.ly/4dcyny3
※ Follow X to check out the posts.
※ X를 팔로우하고 게시물을 확인하세요.
◆ t.me/readCryptoChannel
[HA-MS Indicator]
bit.ly/3YxHgvN
[OBV Indicator]
bit.ly/4dcyny3
Powiązane publikacje
Wyłączenie odpowiedzialności
Informacje i publikacje nie stanowią i nie powinny być traktowane jako porady finansowe, inwestycyjne, tradingowe ani jakiekolwiek inne rekomendacje dostarczane lub zatwierdzone przez TradingView. Więcej informacji znajduje się w Warunkach użytkowania.
YouTube: youtube.com/@readcrypto9837
※ Follow X to check out the posts.
※ X를 팔로우하고 게시물을 확인하세요.
◆ t.me/readCryptoChannel
[HA-MS Indicator]
bit.ly/3YxHgvN
[OBV Indicator]
bit.ly/4dcyny3
※ Follow X to check out the posts.
※ X를 팔로우하고 게시물을 확인하세요.
◆ t.me/readCryptoChannel
[HA-MS Indicator]
bit.ly/3YxHgvN
[OBV Indicator]
bit.ly/4dcyny3
Powiązane publikacje
Wyłączenie odpowiedzialności
Informacje i publikacje nie stanowią i nie powinny być traktowane jako porady finansowe, inwestycyjne, tradingowe ani jakiekolwiek inne rekomendacje dostarczane lub zatwierdzone przez TradingView. Więcej informacji znajduje się w Warunkach użytkowania.