
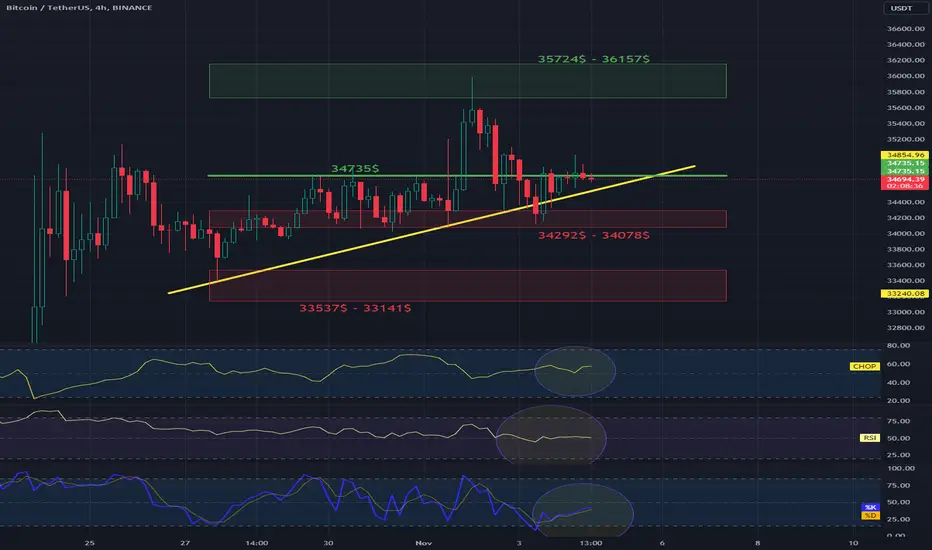
Hello everyone, let's take a look at the BTC to USDT chart on a 4-hour time frame. As you can see, the price remained above the local upward trend line.
After unfolding the Trend Based Fib Extension grid, you can see the support zone from $34,292 to $34,078, and then we have a second strong zone from $33,537 to $33,141.
Looking the other way, you can see that the price is struggling with the resistance at $34,735, but we still have a significant resistance zone from $35,724 to $36,157.
Looking at the CHOP indicator, we see that there is still energy for a move, the RSI indicator shows a sideways move, while the STOCH indicator shows confirmation of the price rebound with room for further growth.

Wyłączenie odpowiedzialności
Informacje i publikacje nie stanowią i nie powinny być traktowane jako porady finansowe, inwestycyjne, tradingowe ani jakiekolwiek inne rekomendacje dostarczane lub zatwierdzone przez TradingView. Więcej informacji znajduje się w Warunkach użytkowania.
Wyłączenie odpowiedzialności
Informacje i publikacje nie stanowią i nie powinny być traktowane jako porady finansowe, inwestycyjne, tradingowe ani jakiekolwiek inne rekomendacje dostarczane lub zatwierdzone przez TradingView. Więcej informacji znajduje się w Warunkach użytkowania.