
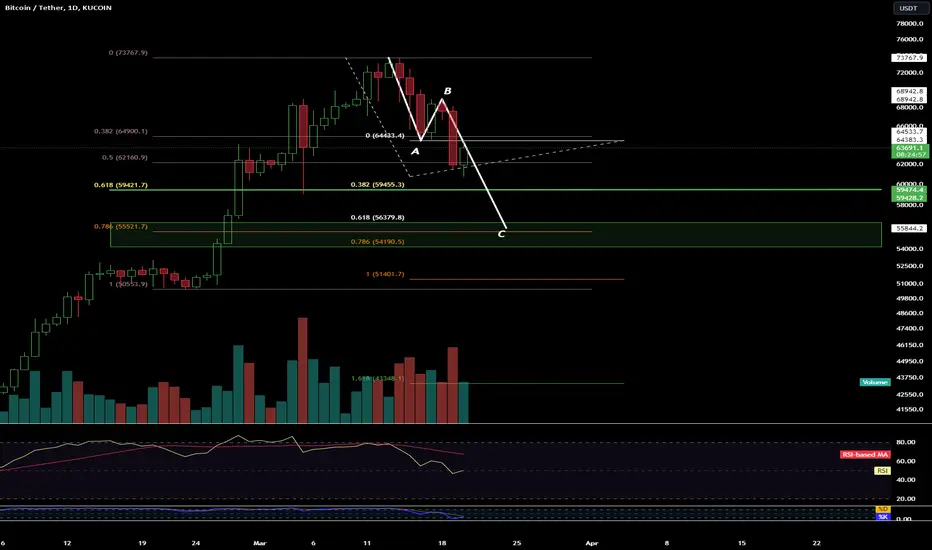
On BTC, you can see the formation of the ABC formation, which would indicate a continuation of the correction to deeper levels.
We can see green candles appearing on the volume, but they are weaker than the red downward ones.
The RSI shows a continuation of the downward movement with room for a greater price recovery.
We can see green candles appearing on the volume, but they are weaker than the red downward ones.
The RSI shows a continuation of the downward movement with room for a greater price recovery.

Wyłączenie odpowiedzialności
Informacje i publikacje nie stanowią i nie powinny być traktowane jako porady finansowe, inwestycyjne, tradingowe ani jakiekolwiek inne rekomendacje dostarczane lub zatwierdzone przez TradingView. Więcej informacji znajduje się w Warunkach użytkowania.
Wyłączenie odpowiedzialności
Informacje i publikacje nie stanowią i nie powinny być traktowane jako porady finansowe, inwestycyjne, tradingowe ani jakiekolwiek inne rekomendacje dostarczane lub zatwierdzone przez TradingView. Więcej informacji znajduje się w Warunkach użytkowania.