
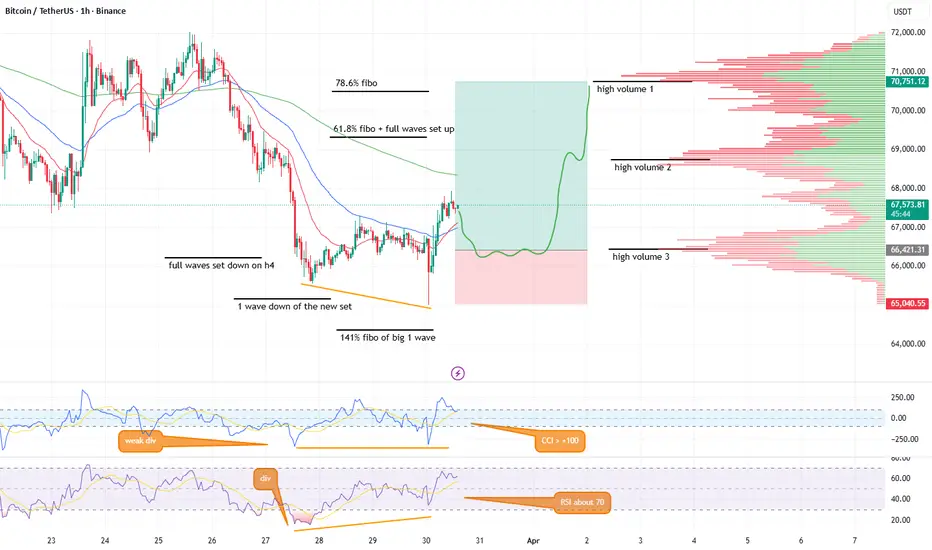
Technical Analysis:
1️⃣СCI - above +100, a decline is needed, followed by another upward move. Weak divergence.
2️⃣RSI - around 70. Also advisable to fall first. There's good divergence.
3️⃣Levels:
🔸High volume 3 = 66,460 + a full set of downward waves on h4 = 66,200 - important resistance
🔸61.8% Fibonacci + a full set of upward waves = 69,350 - potential price stop
🔸High volume 1 = 70,750 + 78.6% Fibonacci = 75,000 - approximate take-profit level.
4️⃣Elder TF (h4) - 50 EMA approximately at the increased volume level 2 = 68770. Another potential resistance point on the way up.
5️⃣Price movement forecast - on the chart.
Entry, stop, take:
🔸Entry: Buy. Breakout above the increased volume level 3 = 66460
🔸Stop: Preliminary beyond the peak of 65020, but may be adjusted, depending on the price action.
🔸Take Profit: high volume 1 = 70,750.
🔸Risk/Reward: 3.14
🔸Execution: Within a week.
Cancellation
🔸No breakout of high volume 3 = 66,460 or a sharp drop to 141% Fibonacci level of the large first wave = 64,400
Fundamentals:
1️⃣ Fear Index: 8 (Extreme Fear, ~7 weeks in a row) → 🟢 Positive for BTC. Longest streak of extreme fear since late 2022. A trigger is needed for an upward move.
2️⃣ BTC Dominance: 56–57% → ⚪ Neutral. Capital favors BTC over altcoins (ETH/BTC 0.030 is a multi-year low).
3️⃣ Funding Rate: negative for almost all of March, has turned slightly positive (+0.0003–0.0005%) in the last 16 hours (Binance API) → 🟢 Positive for BTC. A positive funding reversal could signal the beginning of a sentiment shift.
4️⃣ Open Interest: $102–112B, funding has just turned positive (Binance API) → ⚪ Neutral. A positive funding reversal (since March 29) could mean shorts are starting to close or longs are being added.
5️⃣ Liquidations (March 27): $451M, 122K traders → ⚪ Neutral. There are conditions for an upward move, we are waiting for a trigger.
6️⃣ ETF Flows: -$171M (March 27), week ~-$71M, March $890M vs. $3.3B in February → 🔴 Negative for BTC. Outflows across all 11 funds. Institutions are reducing positions.
7️⃣ Exchange Flows: Steady outflow throughout March → 🟢 Positive for BTC. Exchange reserves at multi-month lows.
8️⃣ MVRV: ~1.50 → ⚪ Neutral. Market in the middle of the price range.
9️⃣ Whale Inflow Ratio: 0.64 (down from a peak of 0.85 in February; normal 0.35–0.55) → ⚪ Neutral. 80% of exchange deposits come from large wallets, but the trend is downward.
🔟 Top Holders: 270,000 BTC accumulated in 30 days – a 13-year record → 🟢 Positive for BTC. Whales are accumulating.
1️⃣1️⃣ Geopolitics: US/Iran war → 🔴 Negative for BTC. The most significant negative. Potential for a sharp rebound if de-escalation occurs.
Conclusion: 👈🏻 War still determines the movement direction.
1️⃣СCI - above +100, a decline is needed, followed by another upward move. Weak divergence.
2️⃣RSI - around 70. Also advisable to fall first. There's good divergence.
3️⃣Levels:
🔸High volume 3 = 66,460 + a full set of downward waves on h4 = 66,200 - important resistance
🔸61.8% Fibonacci + a full set of upward waves = 69,350 - potential price stop
🔸High volume 1 = 70,750 + 78.6% Fibonacci = 75,000 - approximate take-profit level.
4️⃣Elder TF (h4) - 50 EMA approximately at the increased volume level 2 = 68770. Another potential resistance point on the way up.
5️⃣Price movement forecast - on the chart.
Entry, stop, take:
🔸Entry: Buy. Breakout above the increased volume level 3 = 66460
🔸Stop: Preliminary beyond the peak of 65020, but may be adjusted, depending on the price action.
🔸Take Profit: high volume 1 = 70,750.
🔸Risk/Reward: 3.14
🔸Execution: Within a week.
Cancellation
🔸No breakout of high volume 3 = 66,460 or a sharp drop to 141% Fibonacci level of the large first wave = 64,400
Fundamentals:
1️⃣ Fear Index: 8 (Extreme Fear, ~7 weeks in a row) → 🟢 Positive for BTC. Longest streak of extreme fear since late 2022. A trigger is needed for an upward move.
2️⃣ BTC Dominance: 56–57% → ⚪ Neutral. Capital favors BTC over altcoins (ETH/BTC 0.030 is a multi-year low).
3️⃣ Funding Rate: negative for almost all of March, has turned slightly positive (+0.0003–0.0005%) in the last 16 hours (Binance API) → 🟢 Positive for BTC. A positive funding reversal could signal the beginning of a sentiment shift.
4️⃣ Open Interest: $102–112B, funding has just turned positive (Binance API) → ⚪ Neutral. A positive funding reversal (since March 29) could mean shorts are starting to close or longs are being added.
5️⃣ Liquidations (March 27): $451M, 122K traders → ⚪ Neutral. There are conditions for an upward move, we are waiting for a trigger.
6️⃣ ETF Flows: -$171M (March 27), week ~-$71M, March $890M vs. $3.3B in February → 🔴 Negative for BTC. Outflows across all 11 funds. Institutions are reducing positions.
7️⃣ Exchange Flows: Steady outflow throughout March → 🟢 Positive for BTC. Exchange reserves at multi-month lows.
8️⃣ MVRV: ~1.50 → ⚪ Neutral. Market in the middle of the price range.
9️⃣ Whale Inflow Ratio: 0.64 (down from a peak of 0.85 in February; normal 0.35–0.55) → ⚪ Neutral. 80% of exchange deposits come from large wallets, but the trend is downward.
🔟 Top Holders: 270,000 BTC accumulated in 30 days – a 13-year record → 🟢 Positive for BTC. Whales are accumulating.
1️⃣1️⃣ Geopolitics: US/Iran war → 🔴 Negative for BTC. The most significant negative. Potential for a sharp rebound if de-escalation occurs.
Conclusion: 👈🏻 War still determines the movement direction.

Powiązane publikacje
Wyłączenie odpowiedzialności
Informacje i publikacje nie stanowią i nie powinny być traktowane jako porady finansowe, inwestycyjne, tradingowe ani jakiekolwiek inne rekomendacje dostarczane lub zatwierdzone przez TradingView. Więcej informacji znajduje się w Warunkach użytkowania.
Powiązane publikacje
Wyłączenie odpowiedzialności
Informacje i publikacje nie stanowią i nie powinny być traktowane jako porady finansowe, inwestycyjne, tradingowe ani jakiekolwiek inne rekomendacje dostarczane lub zatwierdzone przez TradingView. Więcej informacji znajduje się w Warunkach użytkowania.