
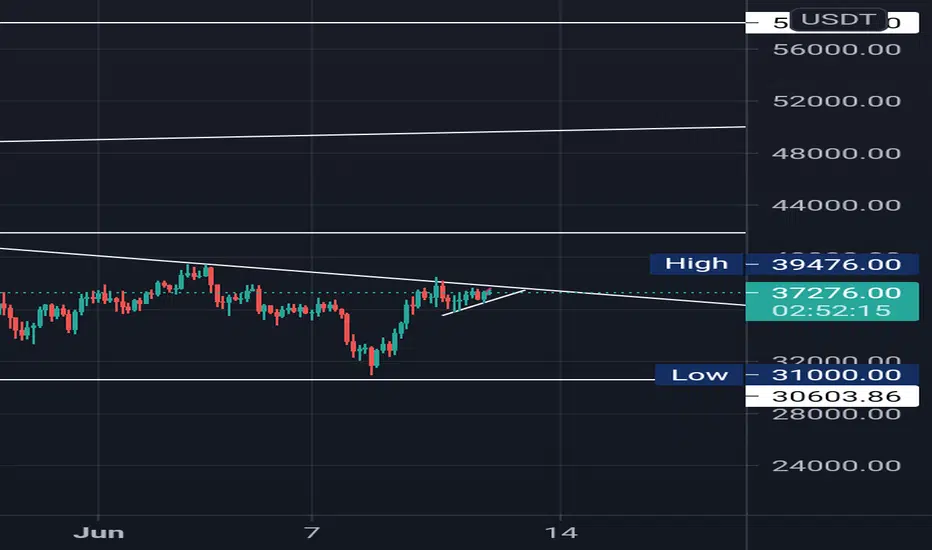
After 30,000 low
On 1D time frame we can see a descending triangle.
When we move to 4hr chart one more pattern " symmetric triangle " forming at the resistance of descending triangle (1D)
Moving at 15 min chart noticed a flag and pole condition the rsi was indicating OB.
I've entered at 37095 with sl or 36375 and target with 40,000 as round figure and 41900 (t2)
On 1D time frame we can see a descending triangle.
When we move to 4hr chart one more pattern " symmetric triangle " forming at the resistance of descending triangle (1D)
Moving at 15 min chart noticed a flag and pole condition the rsi was indicating OB.
I've entered at 37095 with sl or 36375 and target with 40,000 as round figure and 41900 (t2)

Wyłączenie odpowiedzialności
Informacje i publikacje nie stanowią i nie powinny być traktowane jako porady finansowe, inwestycyjne, tradingowe ani jakiekolwiek inne rekomendacje dostarczane lub zatwierdzone przez TradingView. Więcej informacji znajduje się w Warunkach użytkowania.
Wyłączenie odpowiedzialności
Informacje i publikacje nie stanowią i nie powinny być traktowane jako porady finansowe, inwestycyjne, tradingowe ani jakiekolwiek inne rekomendacje dostarczane lub zatwierdzone przez TradingView. Więcej informacji znajduje się w Warunkach użytkowania.