
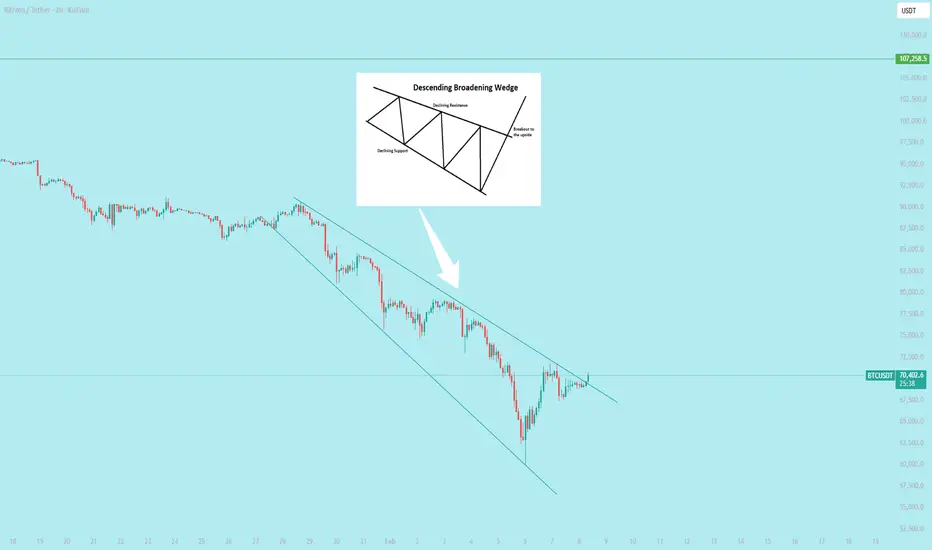
Bitcoin has broken out of a **Descending Broadening Wedge** pattern on the **2-hour timeframe**!
This classic pattern features diverging downward-sloping trendlines with increasing volatility — often appearing at the end of a consolidation or downtrend phase. Statistically, descending broadening wedges show a strong bullish bias on upward breakouts (around 70-80% probability in many historical studies).
We've now seen a clean break above the upper resistance line, signaling that buyers are taking control with fresh momentum.
**Current Situation (as of Feb 8, 2026):**
- BTC is trading around $69,000–$70,000 after recent choppy action and a sharp dip/recovery earlier this week.
- The breakout looks promising, but crypto remains volatile — watch closely!
**Key Things to Monitor:**
✅ **Confirmation**: Price needs to hold firmly above the breakout level with rising volume to confirm strength and lower fakeout risk.
⚠️ **Fakeout Danger**: If price reverses quickly back into the wedge or turns the broken line into resistance, the setup could fail (watch recent lows for invalidation).
🎯 **Potential Targets**: If momentum builds, a measured move from the pattern could deliver a solid upward leg — room for a nice pump if buyers stay aggressive.
Stay disciplined: Manage your risk, avoid FOMO chasing, and don't go all-in blindly. This could kick off a strong move, but remember — Bitcoin loves throwing fakeouts! 😅

Wyłączenie odpowiedzialności
Informacje i publikacje nie stanowią i nie powinny być traktowane jako porady finansowe, inwestycyjne, tradingowe ani jakiekolwiek inne rekomendacje dostarczane lub zatwierdzone przez TradingView. Więcej informacji znajduje się w Warunkach użytkowania.
Wyłączenie odpowiedzialności
Informacje i publikacje nie stanowią i nie powinny być traktowane jako porady finansowe, inwestycyjne, tradingowe ani jakiekolwiek inne rekomendacje dostarczane lub zatwierdzone przez TradingView. Więcej informacji znajduje się w Warunkach użytkowania.