
This is a short to medium term analysis. I invite you to check my last daily chart for more info (tradingview.com/chart/BTCUSDT/0YHr0d74-BTC-Daily-Bearish-divergence-Ichimoku-Rising-wedge/).
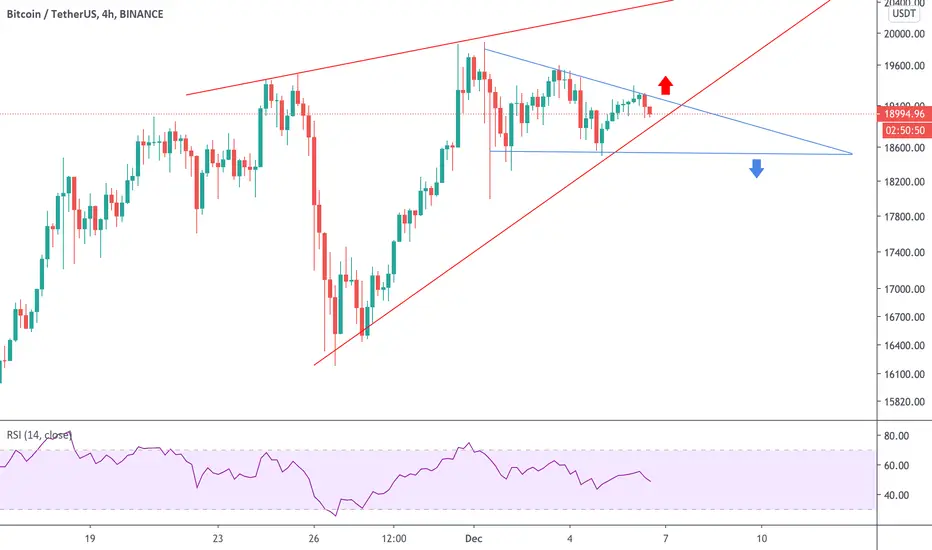
The BTCUSD 4 hour chart shows 2 patterns:
- a rising wedge (in red): would mean we go touch the upper line (20k+), before going south again.
- a descending triangle (in blue): would mean we break the rising wedge and continue bouncing within the blue triangle, and then go south.
Pick your favorite scenario.
Don't guess, follow the price and plan your trade.
The BTCUSD 4 hour chart shows 2 patterns:
- a rising wedge (in red): would mean we go touch the upper line (20k+), before going south again.
- a descending triangle (in blue): would mean we break the rising wedge and continue bouncing within the blue triangle, and then go south.
Pick your favorite scenario.
Don't guess, follow the price and plan your trade.

Wyłączenie odpowiedzialności
Informacje i publikacje nie stanowią i nie powinny być traktowane jako porady finansowe, inwestycyjne, tradingowe ani jakiekolwiek inne rekomendacje dostarczane lub zatwierdzone przez TradingView. Więcej informacji znajduje się w Warunkach użytkowania.
Wyłączenie odpowiedzialności
Informacje i publikacje nie stanowią i nie powinny być traktowane jako porady finansowe, inwestycyjne, tradingowe ani jakiekolwiek inne rekomendacje dostarczane lub zatwierdzone przez TradingView. Więcej informacji znajduje się w Warunkach użytkowania.