
Hi Guys,
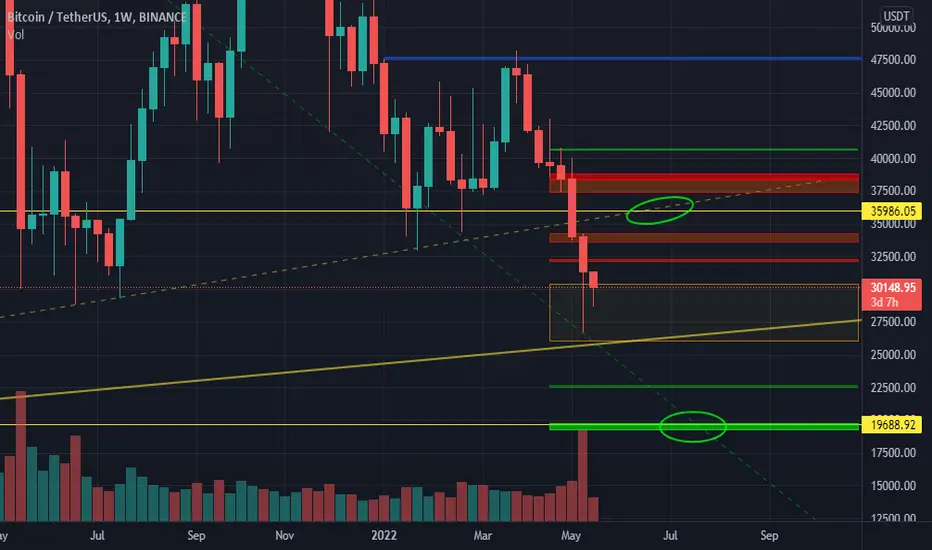
This is a schematic view on mid/long term support/resistance zones in Bitcoin.
those two green circles are highly attractive zones, price might move in a pattern to touch them. so it might give you some hints about the timing analysis.
the yellow line on current zone is very important and make sure you won't ignore it.
for a better understanding, check the post below, related to ETH.

Powiązane publikacje
Wyłączenie odpowiedzialności
Informacje i publikacje nie stanowią i nie powinny być traktowane jako porady finansowe, inwestycyjne, tradingowe ani jakiekolwiek inne rekomendacje dostarczane lub zatwierdzone przez TradingView. Więcej informacji znajduje się w Warunkach użytkowania.