
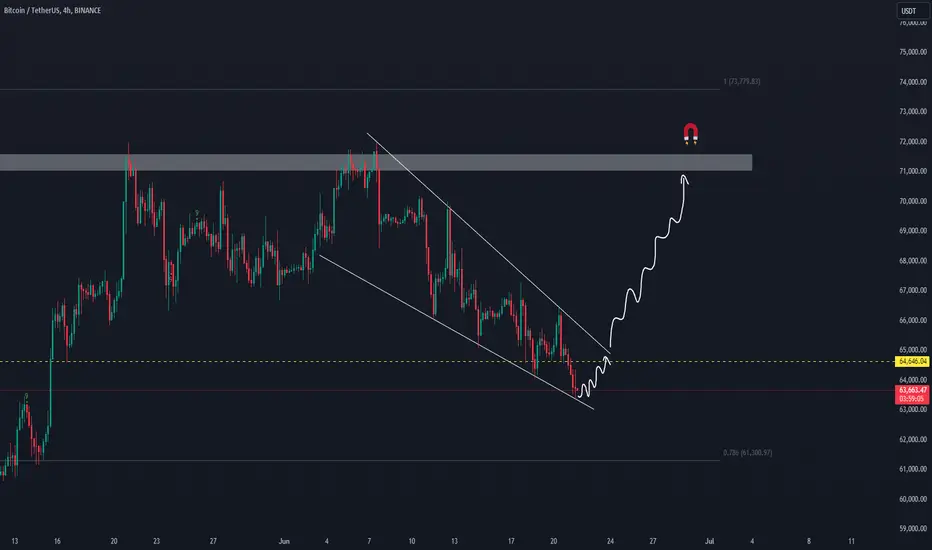
Analyzing the 4-hour Bitcoin chart, we can observe a descending wedge pattern forming. Currently, the price has reached the support line of this formation. If it bounces off this support and breaks through the resistance line, it will confirm the upward momentum. These patterns typically indicate a bullish reversal, leading to a potential rise. Target: Bitcoin (BTC) Target: $71,000, expected to be reached within a week. Let's keep an eye on this pattern for a breakout to confirm the bullish scenario!

Wyłączenie odpowiedzialności
Informacje i publikacje nie stanowią i nie powinny być traktowane jako porady finansowe, inwestycyjne, tradingowe ani jakiekolwiek inne rekomendacje dostarczane lub zatwierdzone przez TradingView. Więcej informacji znajduje się w Warunkach użytkowania.
Wyłączenie odpowiedzialności
Informacje i publikacje nie stanowią i nie powinny być traktowane jako porady finansowe, inwestycyjne, tradingowe ani jakiekolwiek inne rekomendacje dostarczane lub zatwierdzone przez TradingView. Więcej informacji znajduje się w Warunkach użytkowania.