
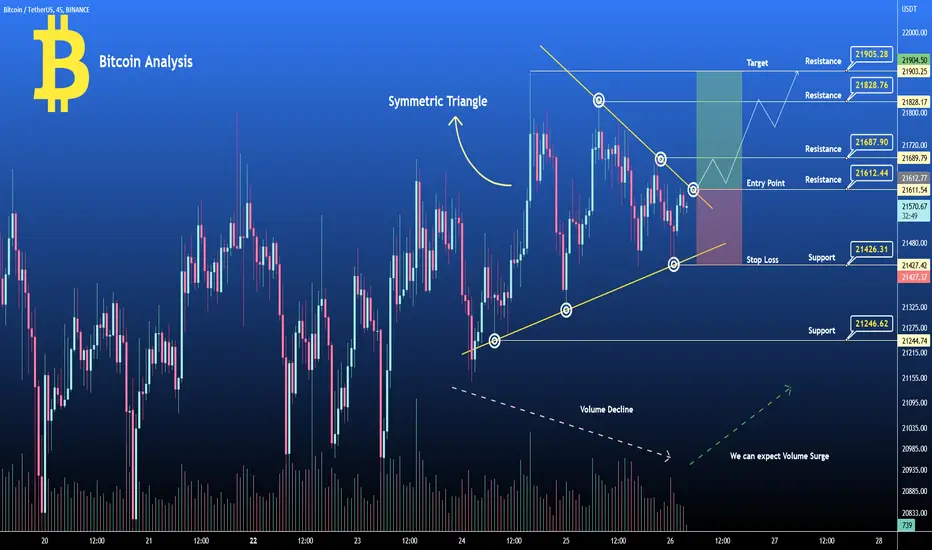
The above chart of Bitcoin ( BTCUSDT ) laid out the Symmetric triangle pattern. Currently, Bitcoin ( BTCUSDT ) is in the range of $21580. If the pattern continues, the price of Bitcoin ( BTCUSDT ) might reach the resistance levels of $21900, If the trend reverses, then the price of Bitcoin ( BTCUSDT ) may fall to $21420
RSI - Below 50
Trade Level
Buy Entry : $21615
Target : $21900
Stop Loss : $21420
Happy Trading $$$$
RSI - Below 50
Trade Level
Buy Entry : $21615
Target : $21900
Stop Loss : $21420
Happy Trading $$$$
Uwaga
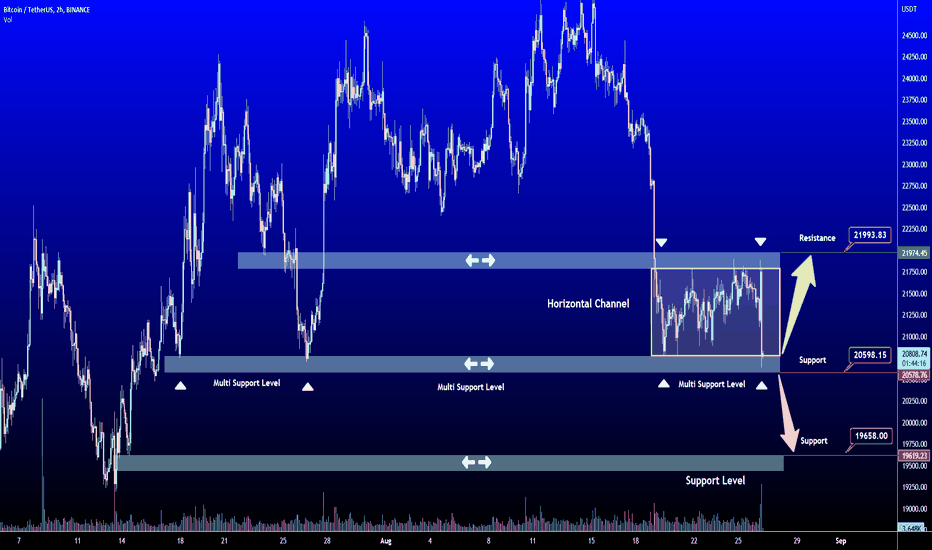
Uwaga
Fresh View Above
Powiązane publikacje
Wyłączenie odpowiedzialności
Informacje i publikacje nie stanowią i nie powinny być traktowane jako porady finansowe, inwestycyjne, tradingowe ani jakiekolwiek inne rekomendacje dostarczane lub zatwierdzone przez TradingView. Więcej informacji znajduje się w Warunkach użytkowania.
Powiązane publikacje
Wyłączenie odpowiedzialności
Informacje i publikacje nie stanowią i nie powinny być traktowane jako porady finansowe, inwestycyjne, tradingowe ani jakiekolwiek inne rekomendacje dostarczane lub zatwierdzone przez TradingView. Więcej informacji znajduje się w Warunkach użytkowania.