
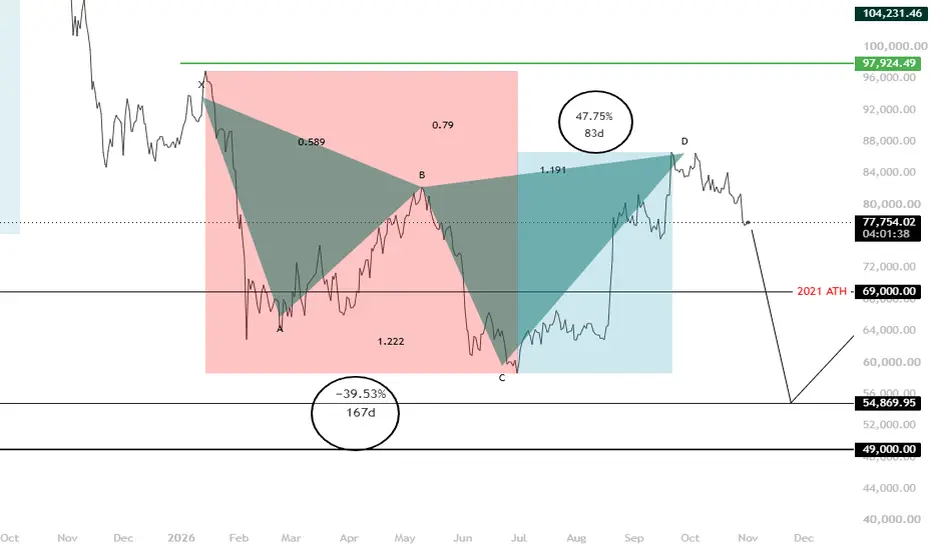
The harmonic pattern shown is a cypher on the Bitcoin weekly timeframe. The chart shown is a daily line chart set on closing price, this is intentional to show the harmony between the sell and buy side.
We have a drop from X to C taking 168 days. The rise in price took 84 days. I will leave you to do the math and work out the relationship.
I believe we see a bigger than expected drop to 54k give or take. I have seen lots of 74k predictions but due to many external factors a sharp drop to 54 seems more in order.
We have a drop from X to C taking 168 days. The rise in price took 84 days. I will leave you to do the math and work out the relationship.
I believe we see a bigger than expected drop to 54k give or take. I have seen lots of 74k predictions but due to many external factors a sharp drop to 54 seems more in order.

Wyłączenie odpowiedzialności
Informacje i publikacje nie stanowią i nie powinny być traktowane jako porady finansowe, inwestycyjne, tradingowe ani jakiekolwiek inne rekomendacje dostarczane lub zatwierdzone przez TradingView. Więcej informacji znajduje się w Warunkach użytkowania.
Wyłączenie odpowiedzialności
Informacje i publikacje nie stanowią i nie powinny być traktowane jako porady finansowe, inwestycyjne, tradingowe ani jakiekolwiek inne rekomendacje dostarczane lub zatwierdzone przez TradingView. Więcej informacji znajduje się w Warunkach użytkowania.