

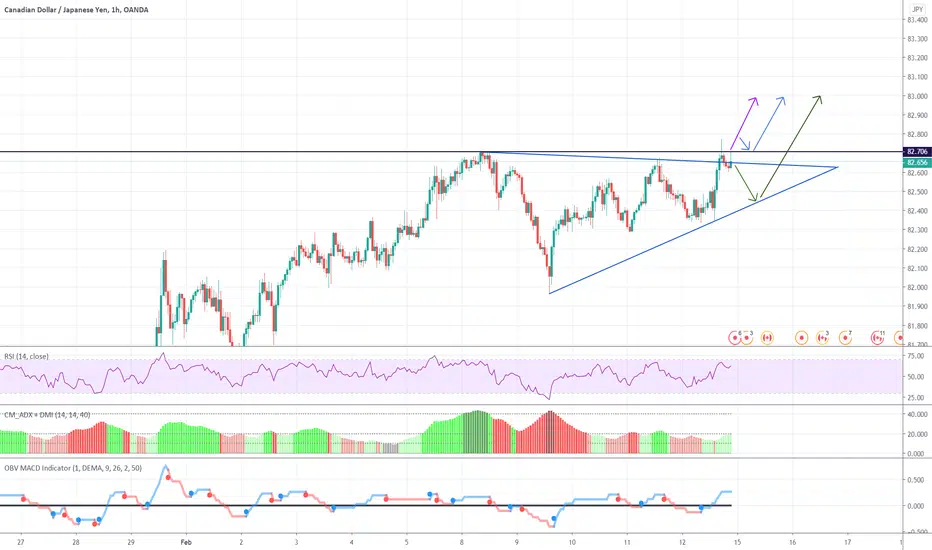
CADJPY possible long scenarios represented by the coloured arrows.
Scenario 1 (Green Arrow): we see a wedge pattern where it bounces of lower boundary to then make a move to the upside breaking out to resistance at 83.000 (psychological price level).
Scenario 2 (Blue Arrow): We see it break upper resistance (Black line), retest then move towards 83.000
Scenario 3: We watch for a breakout of upper resistance and a move towards 83.000
Looking at the moving average we see price in a upwards trend, hence the reason for not looking at taking a short
Scenario 1 (Green Arrow): we see a wedge pattern where it bounces of lower boundary to then make a move to the upside breaking out to resistance at 83.000 (psychological price level).
Scenario 2 (Blue Arrow): We see it break upper resistance (Black line), retest then move towards 83.000
Scenario 3: We watch for a breakout of upper resistance and a move towards 83.000
Looking at the moving average we see price in a upwards trend, hence the reason for not looking at taking a short
Transakcja zamknięta: osiągnięto wyznaczony cel
Fantastic trade here, broke out to the upside
Wyłączenie odpowiedzialności
Informacje i publikacje nie stanowią i nie powinny być traktowane jako porady finansowe, inwestycyjne, tradingowe ani jakiekolwiek inne rekomendacje dostarczane lub zatwierdzone przez TradingView. Więcej informacji znajduje się w Warunkach użytkowania.
Wyłączenie odpowiedzialności
Informacje i publikacje nie stanowią i nie powinny być traktowane jako porady finansowe, inwestycyjne, tradingowe ani jakiekolwiek inne rekomendacje dostarczane lub zatwierdzone przez TradingView. Więcej informacji znajduje się w Warunkach użytkowania.