
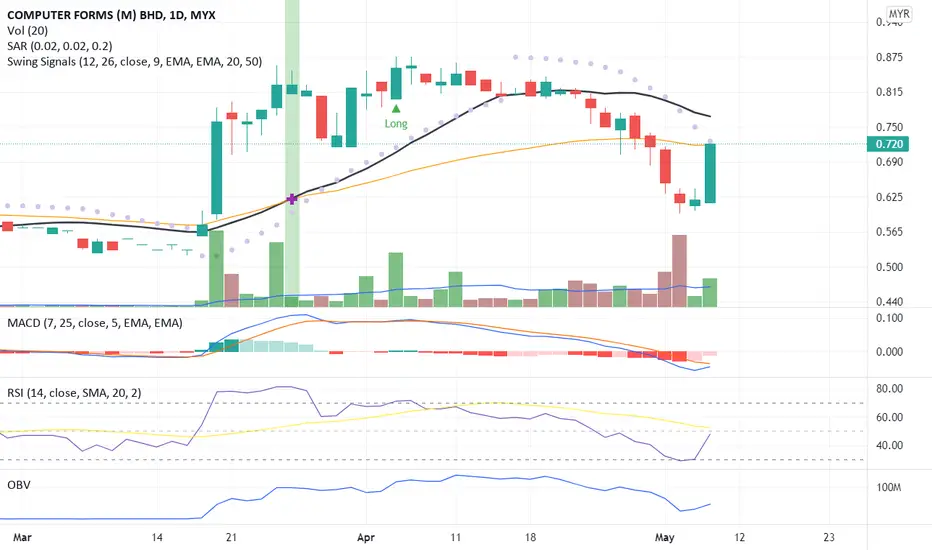
The candlestick body indicate a breakout pattern due to signicant price movement on previous trading where the price croses over the MA50 line. Hence, with probability of begining of uptrend pattern.
The RSI indicates a strong gain momumtum towards indexes 50.
MACD and OBV indicate an early sign of a divergence pattern.
Precaution for a price correction between 10% to 20% from recent price peak before continue with the uptrend momentum.
Let save CFM in WL and watchout for price uptrend movement to next price resistance, the MA20 line.
R 0.770
S 0.635
The RSI indicates a strong gain momumtum towards indexes 50.
MACD and OBV indicate an early sign of a divergence pattern.
Precaution for a price correction between 10% to 20% from recent price peak before continue with the uptrend momentum.
Let save CFM in WL and watchout for price uptrend movement to next price resistance, the MA20 line.
R 0.770
S 0.635

Wyłączenie odpowiedzialności
Informacje i publikacje nie stanowią i nie powinny być traktowane jako porady finansowe, inwestycyjne, tradingowe ani jakiekolwiek inne rekomendacje dostarczane lub zatwierdzone przez TradingView. Więcej informacji znajduje się w Warunkach użytkowania.
Wyłączenie odpowiedzialności
Informacje i publikacje nie stanowią i nie powinny być traktowane jako porady finansowe, inwestycyjne, tradingowe ani jakiekolwiek inne rekomendacje dostarczane lub zatwierdzone przez TradingView. Więcej informacji znajduje się w Warunkach użytkowania.