

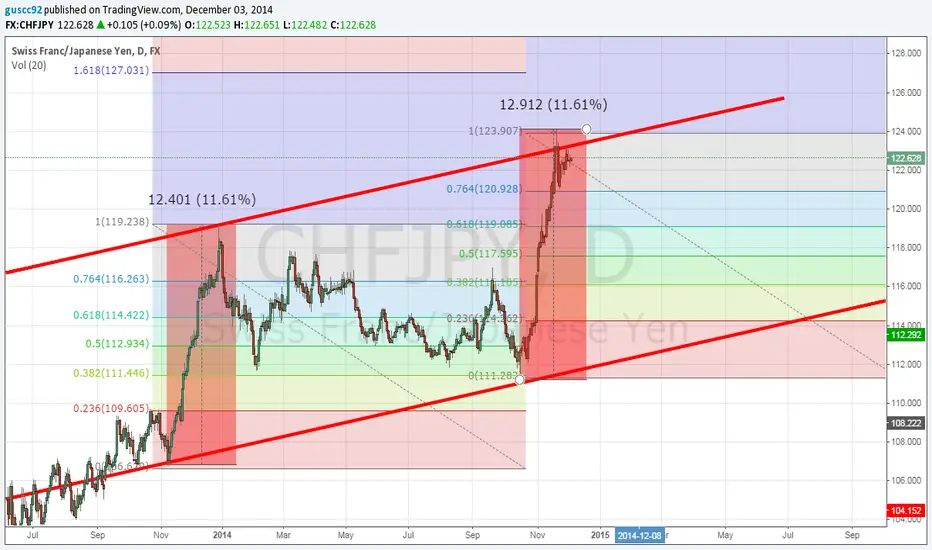
There is a marked long trend tendency with similar resistance and support lines.
Inside that, we can see how the bullish price is strong and has had a retracement of 61.8%.
Both fibonacci are exactly the same, and as we can see, the story seems to repeat.
We can also see how both range have exactly the same % with very similar price unit ranges.
Inside that, we can see how the bullish price is strong and has had a retracement of 61.8%.
Both fibonacci are exactly the same, and as we can see, the story seems to repeat.
We can also see how both range have exactly the same % with very similar price unit ranges.

Wyłączenie odpowiedzialności
Informacje i publikacje nie stanowią i nie powinny być traktowane jako porady finansowe, inwestycyjne, tradingowe ani jakiekolwiek inne rekomendacje dostarczane lub zatwierdzone przez TradingView. Więcej informacji znajduje się w Warunkach użytkowania.
Wyłączenie odpowiedzialności
Informacje i publikacje nie stanowią i nie powinny być traktowane jako porady finansowe, inwestycyjne, tradingowe ani jakiekolwiek inne rekomendacje dostarczane lub zatwierdzone przez TradingView. Więcej informacji znajduje się w Warunkach użytkowania.