
27-11
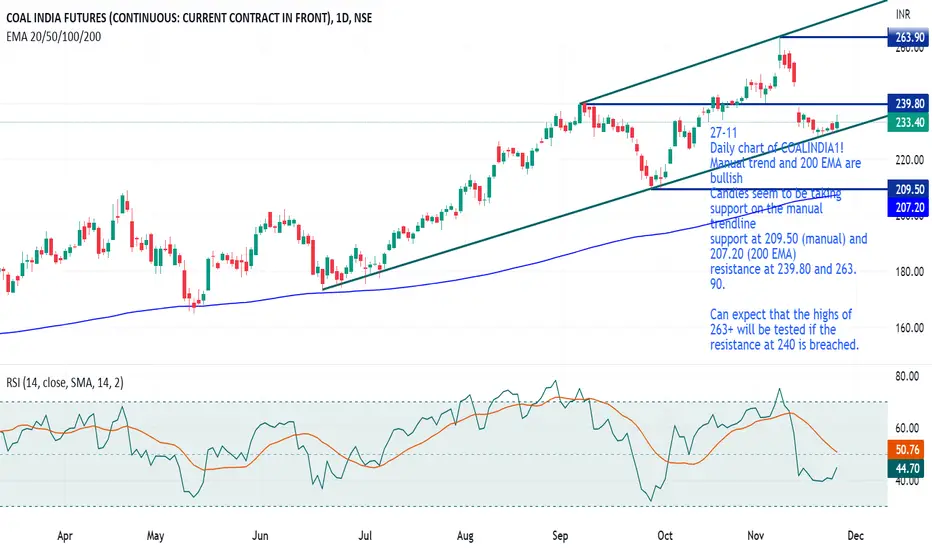
Daily chart of COALINDIA1!
Manual trend and 200 EMA are bullish
Candles seem to be taking support on the manual trendline
support at 209.50 (manual) and 207.20 (200 EMA)
resistance at 239.80 and 263.90.
Can expect that the highs of 263+ will be tested if the resistance at 240 is breached.
Daily chart of COALINDIA1!
Manual trend and 200 EMA are bullish
Candles seem to be taking support on the manual trendline
support at 209.50 (manual) and 207.20 (200 EMA)
resistance at 239.80 and 263.90.
Can expect that the highs of 263+ will be tested if the resistance at 240 is breached.

Wyłączenie odpowiedzialności
Informacje i publikacje nie stanowią i nie powinny być traktowane jako porady finansowe, inwestycyjne, tradingowe ani jakiekolwiek inne rekomendacje dostarczane lub zatwierdzone przez TradingView. Więcej informacji znajduje się w Warunkach użytkowania.
Wyłączenie odpowiedzialności
Informacje i publikacje nie stanowią i nie powinny być traktowane jako porady finansowe, inwestycyjne, tradingowe ani jakiekolwiek inne rekomendacje dostarczane lub zatwierdzone przez TradingView. Więcej informacji znajduje się w Warunkach użytkowania.