
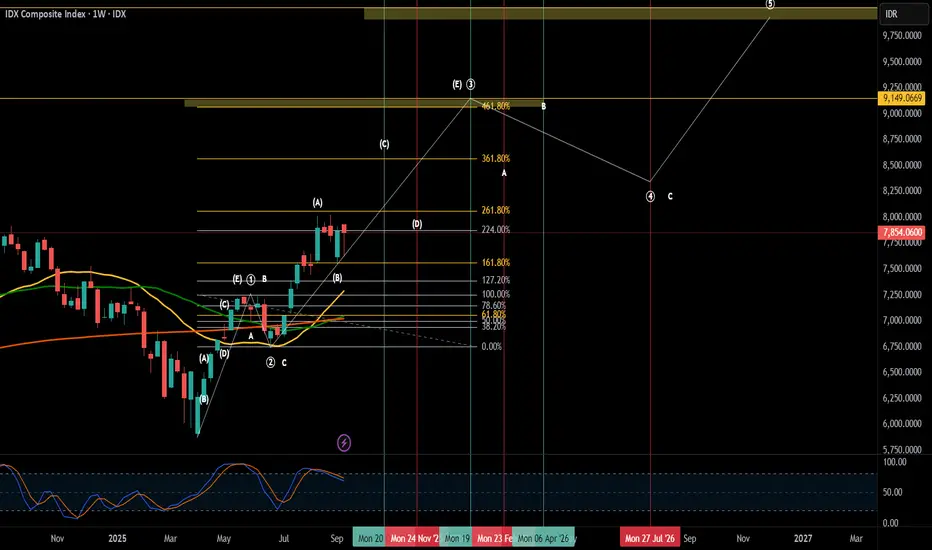
📈 IDX Roadmap — Impulsive Bullish Trend
This roadmap outlines a potential impulsive bullish structure on the IDX Composite Index over the medium to long term.
The projection is based on Elliott Wave structure combined with Fibonacci Extension levels to map out possible price trajectories.
🟢 Green Vertical Lines — Vibrational Date (Bull)
Indicate potential bullish acceleration phases, aligned with wave cycle timing and supported by technical signals from moving averages and the stochastic oscillator.
🔴 Red Vertical Lines — Vibrational Date (Bear)
Indicate potential short-term corrective (bearish) phases, expected before the main bullish trend resumes.
📌 Note:
- This roadmap is not a buy/sell recommendation. It’s meant as a big-picture directional guide to help anticipate market behavior.
-Always apply risk management and look for confirmation on lower timeframes.
This roadmap outlines a potential impulsive bullish structure on the IDX Composite Index over the medium to long term.
The projection is based on Elliott Wave structure combined with Fibonacci Extension levels to map out possible price trajectories.
🟢 Green Vertical Lines — Vibrational Date (Bull)
Indicate potential bullish acceleration phases, aligned with wave cycle timing and supported by technical signals from moving averages and the stochastic oscillator.
🔴 Red Vertical Lines — Vibrational Date (Bear)
Indicate potential short-term corrective (bearish) phases, expected before the main bullish trend resumes.
📌 Note:
- This roadmap is not a buy/sell recommendation. It’s meant as a big-picture directional guide to help anticipate market behavior.
-Always apply risk management and look for confirmation on lower timeframes.

Wyłączenie odpowiedzialności
Informacje i publikacje nie stanowią i nie powinny być traktowane jako porady finansowe, inwestycyjne, tradingowe ani jakiekolwiek inne rekomendacje dostarczane lub zatwierdzone przez TradingView. Więcej informacji znajduje się w Warunkach użytkowania.
Wyłączenie odpowiedzialności
Informacje i publikacje nie stanowią i nie powinny być traktowane jako porady finansowe, inwestycyjne, tradingowe ani jakiekolwiek inne rekomendacje dostarczane lub zatwierdzone przez TradingView. Więcej informacji znajduje się w Warunkach użytkowania.