
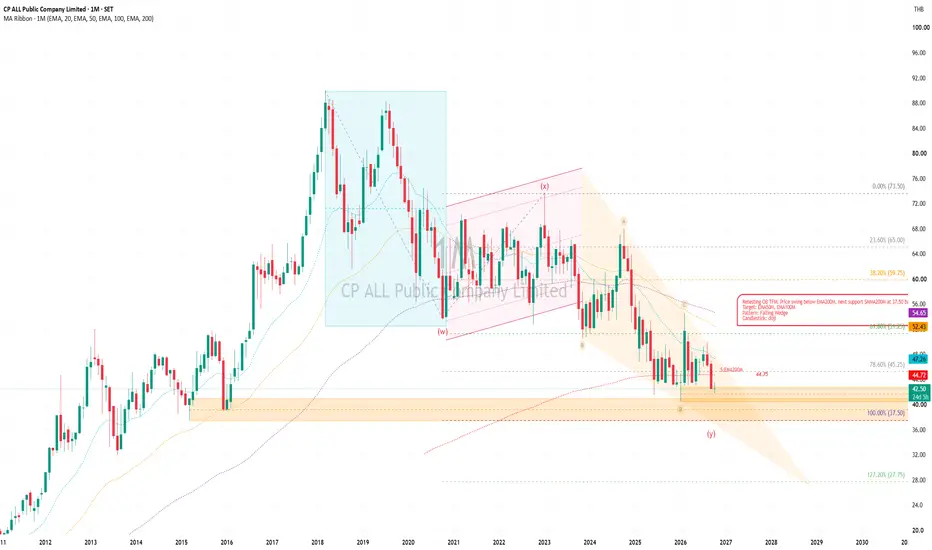
Wave Pattern Analysis: WXY
- W - Extended Flat
- X - Bear Flag
- Y - Falling Wedge ** Normally the last correction
TFM candlestick: Doji
Long Entry @ Falling Wedge Wave Y breakout
Target Upside: Immediate 20% - 30% EMA50 - 100 - month
Support Zone (Monthly Order Block & Dynamic Support): Price is holding the upper boundary of the January 2026 Order Block (OB) around 42.00–42.50 THB. Concurrently, the 200-month EMA is acting as a strong macro dynamic floor, absorbing selling pressure/ liquidity.
Key Dynamic Resistance: The immediate hurdle on any recovery attempt remains the 20-month EMA (around the 44.75–45.75 THB region)
Upside Targets: A decisive close above the 20-month EMA opens the pathway toward higher-frame dynamic targets at the 50-month and 100-month EMAs + 20% - 30% upside
If price loses the upper edge of the weekly OB and breaks below the 200-month EMA, the next major downside structural support sits around the lower yellow liquidity box near 37.50 THB(SMMA 200 Month)
***Look out for possible as a false breakdown - Liquidity trading zone***
- W - Extended Flat
- X - Bear Flag
- Y - Falling Wedge ** Normally the last correction
TFM candlestick: Doji
Long Entry @ Falling Wedge Wave Y breakout
Target Upside: Immediate 20% - 30% EMA50 - 100 - month
Support Zone (Monthly Order Block & Dynamic Support): Price is holding the upper boundary of the January 2026 Order Block (OB) around 42.00–42.50 THB. Concurrently, the 200-month EMA is acting as a strong macro dynamic floor, absorbing selling pressure/ liquidity.
Key Dynamic Resistance: The immediate hurdle on any recovery attempt remains the 20-month EMA (around the 44.75–45.75 THB region)
Upside Targets: A decisive close above the 20-month EMA opens the pathway toward higher-frame dynamic targets at the 50-month and 100-month EMAs + 20% - 30% upside
If price loses the upper edge of the weekly OB and breaks below the 200-month EMA, the next major downside structural support sits around the lower yellow liquidity box near 37.50 THB(SMMA 200 Month)
***Look out for possible as a false breakdown - Liquidity trading zone***

Wyłączenie odpowiedzialności
Informacje i publikacje nie stanowią i nie powinny być traktowane jako porady finansowe, inwestycyjne, tradingowe ani jakiekolwiek inne rekomendacje dostarczane lub zatwierdzone przez TradingView. Więcej informacji znajduje się w Warunkach użytkowania.
Wyłączenie odpowiedzialności
Informacje i publikacje nie stanowią i nie powinny być traktowane jako porady finansowe, inwestycyjne, tradingowe ani jakiekolwiek inne rekomendacje dostarczane lub zatwierdzone przez TradingView. Więcej informacji znajduje się w Warunkach użytkowania.