
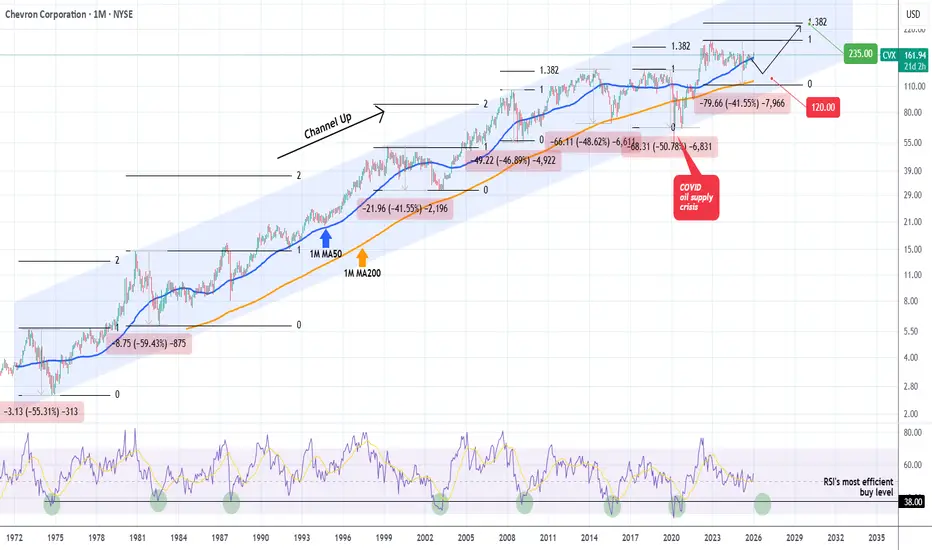
Chevron (CVX) has been trading within a 53-year Channel Up since January 1973. This is the epitome of long-term investing as the pattern has given excellent correction periods (Bear Cycles) to buy for the long-term and Higher Highs to sell and take profit.
During the first years, its Bull Cycles that ended in Higher Highs have been very aggressive, with all three reaching (and even exceeding) the 2.0 Fibonacci extension. In more recent years after the 2008 U.S. Housing Crisis, the two out of three major Bull Cycles (Bullish Legs for the Channel Up) merely reached the 1.382 Fib. All of the Bearish Legs, however, declined by around the same rate (-46.89%, -48.62% and -50.78%). The last two even hit the 1M MA200 (orange trend-line).
As a result, if we assume we will have the minimum of a Bear Cycle Chevron has seen inside this pattern which was the Dotcom's -41.55%, we can expect the current correction to marginally break below the 1M MA200 again to $112.00. However a Target on the 1M MA200 around $120.00 would perhaps be more fair.
The most efficient Buy Signal through this 53-year pattern, ha been when the 1M RSI hit 38.00. As you can see this has happened 7 times, providing the best level to enter for a long-term investor. Consequently, if the 1M RSI hits 38.00 before the stock hits $120.00, it is a good idea for long-term buyers to enter regardless.
The Target then is again the 1.382 Fibonacci extension at around $235.00.
---
** Please LIKE 👍, FOLLOW ✅, SHARE 🙌 and COMMENT ✍ if you enjoy this idea! Also share your ideas and charts in the comments section below! This is best way to keep it relevant, support us, keep the content here free and allow the idea to reach as many people as possible. **
---
💸💸💸💸💸💸
👇 👇 👇 👇 👇 👇
During the first years, its Bull Cycles that ended in Higher Highs have been very aggressive, with all three reaching (and even exceeding) the 2.0 Fibonacci extension. In more recent years after the 2008 U.S. Housing Crisis, the two out of three major Bull Cycles (Bullish Legs for the Channel Up) merely reached the 1.382 Fib. All of the Bearish Legs, however, declined by around the same rate (-46.89%, -48.62% and -50.78%). The last two even hit the 1M MA200 (orange trend-line).
As a result, if we assume we will have the minimum of a Bear Cycle Chevron has seen inside this pattern which was the Dotcom's -41.55%, we can expect the current correction to marginally break below the 1M MA200 again to $112.00. However a Target on the 1M MA200 around $120.00 would perhaps be more fair.
The most efficient Buy Signal through this 53-year pattern, ha been when the 1M RSI hit 38.00. As you can see this has happened 7 times, providing the best level to enter for a long-term investor. Consequently, if the 1M RSI hits 38.00 before the stock hits $120.00, it is a good idea for long-term buyers to enter regardless.
The Target then is again the 1.382 Fibonacci extension at around $235.00.
---
** Please LIKE 👍, FOLLOW ✅, SHARE 🙌 and COMMENT ✍ if you enjoy this idea! Also share your ideas and charts in the comments section below! This is best way to keep it relevant, support us, keep the content here free and allow the idea to reach as many people as possible. **
---
💸💸💸💸💸💸
👇 👇 👇 👇 👇 👇

I trade Crypto, Forex, Indices & Commodities on PrimeXBT — all from one account with TradingView charts 👉 tradingshot.short.gy/PrimeXBT
I also use TradeNation for fixed spreads & zero commission 👉 tradingshot.short.gy/Tradenation
I also use TradeNation for fixed spreads & zero commission 👉 tradingshot.short.gy/Tradenation
Wyłączenie odpowiedzialności
Informacje i publikacje nie stanowią i nie powinny być traktowane jako porady finansowe, inwestycyjne, tradingowe ani jakiekolwiek inne rekomendacje dostarczane lub zatwierdzone przez TradingView. Więcej informacji znajduje się w Warunkach użytkowania.
I trade Crypto, Forex, Indices & Commodities on PrimeXBT — all from one account with TradingView charts 👉 tradingshot.short.gy/PrimeXBT
I also use TradeNation for fixed spreads & zero commission 👉 tradingshot.short.gy/Tradenation
I also use TradeNation for fixed spreads & zero commission 👉 tradingshot.short.gy/Tradenation
Wyłączenie odpowiedzialności
Informacje i publikacje nie stanowią i nie powinny być traktowane jako porady finansowe, inwestycyjne, tradingowe ani jakiekolwiek inne rekomendacje dostarczane lub zatwierdzone przez TradingView. Więcej informacji znajduje się w Warunkach użytkowania.