
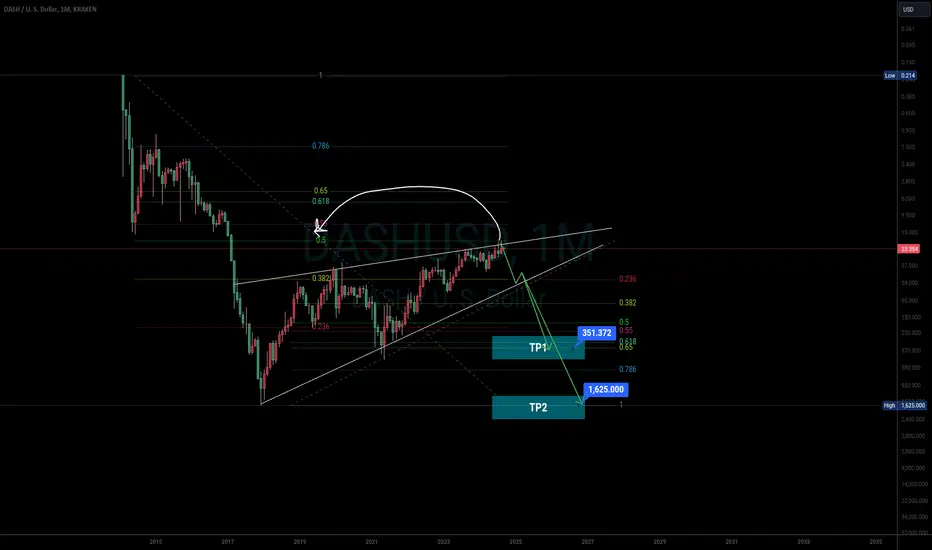
The chart speaks for itself. A textbook rising wedge.
This is NFA
This is NFA
Zlecenie aktywne
I expect the PA to accelerate to around $80 in December.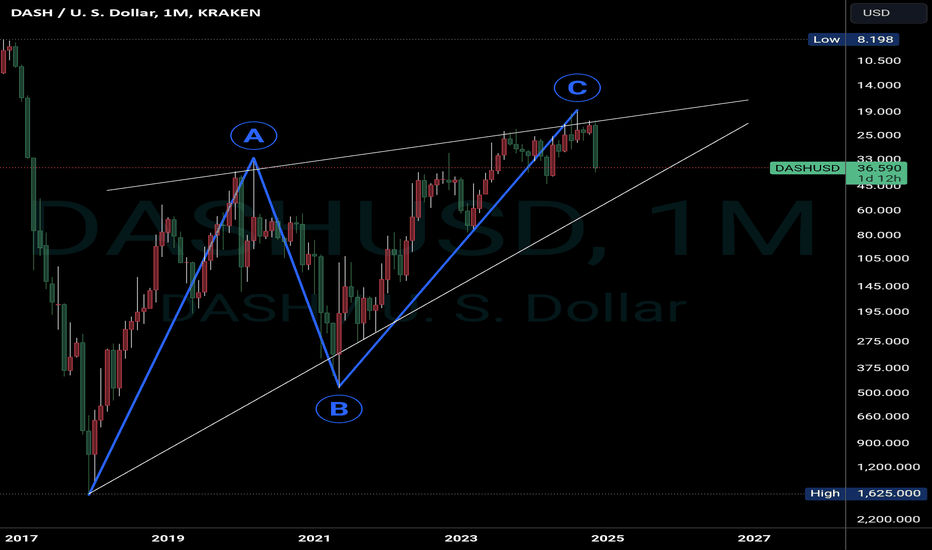
This is not investment advice.
Uwaga
Tick tock Uwaga
I like how the rejection at the top of the falling wedge and recovery is quick. It didn't need to go down the bottom of the wedge to re-test it. This month's candle looks great! Once we're past this wedge it's show time!
Uwaga
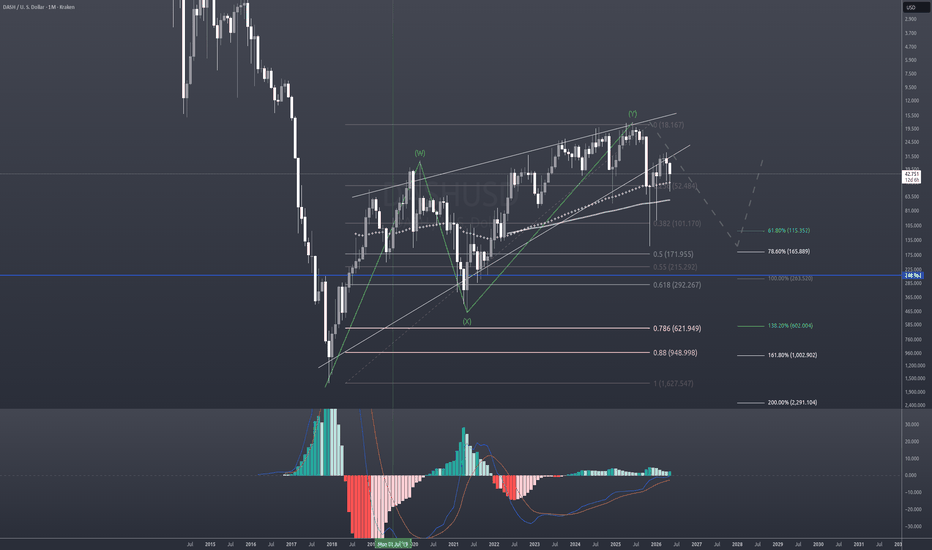
Here's a slightly different way of charting the falling wedge. It's valid too! The difference is that the B wave has a price action overthrow. Why is an overthrow? B typically retraces to 50% of wave A but here it's retraced to more than 65%. That's where I concluded there's an overthrow. It means the top of the wedge needs to come slightly down towards the real price action. What does this all mean?!? It means that right now we're not dealing with a rejection at the top of A re-test from the top down. In other words, we're well past the construct of the falling wedge and DASH is about to go parabolic starting this month!Uwaga

Wyłączenie odpowiedzialności
Informacje i publikacje nie stanowią i nie powinny być traktowane jako porady finansowe, inwestycyjne, tradingowe ani jakiekolwiek inne rekomendacje dostarczane lub zatwierdzone przez TradingView. Więcej informacji znajduje się w Warunkach użytkowania.
Wyłączenie odpowiedzialności
Informacje i publikacje nie stanowią i nie powinny być traktowane jako porady finansowe, inwestycyjne, tradingowe ani jakiekolwiek inne rekomendacje dostarczane lub zatwierdzone przez TradingView. Więcej informacji znajduje się w Warunkach użytkowania.