Long
Dash/Btc potential Head and Shoulder Pattern forming
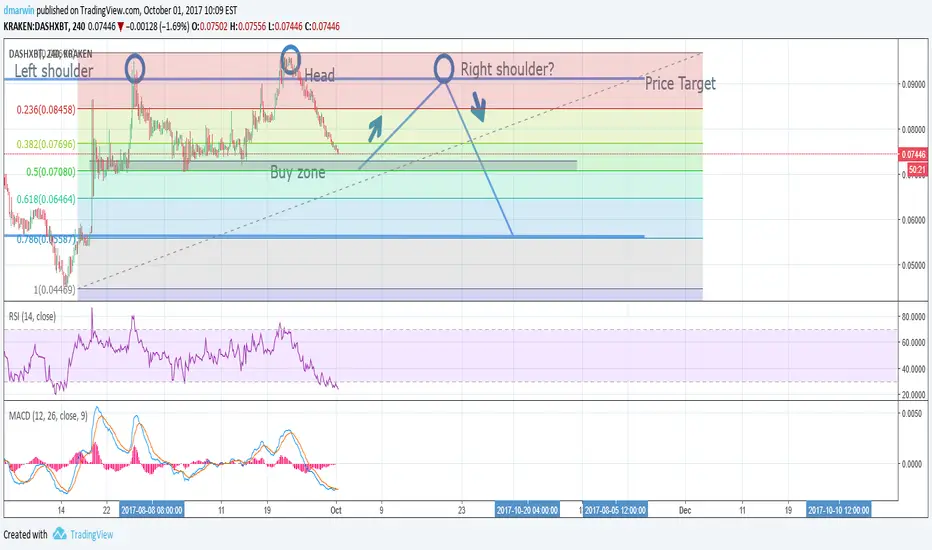
Dash/Btc is forming a potential head and shoulders pattern on the 4hr chart.
Rsi is heavily oversold and Macd is crossing which confirms a reversal to form the right shoulder.
Keep an eye on the daily chart before entering the market there is room for more down although the 0.50 fibinacci level is a strong support.
On the chart you find my buyzone, price target is located at the right shoulder. If it breaks the buyzone support is located at the 61.8 Fibonacci level.
Rsi is heavily oversold and Macd is crossing which confirms a reversal to form the right shoulder.
Keep an eye on the daily chart before entering the market there is room for more down although the 0.50 fibinacci level is a strong support.
On the chart you find my buyzone, price target is located at the right shoulder. If it breaks the buyzone support is located at the 61.8 Fibonacci level.
Uwaga
I entered the long trade with a split order 50% at 0.0730 and 50% at 0.0710 Now let`s see how this goes.

Wyłączenie odpowiedzialności
Informacje i publikacje nie stanowią i nie powinny być traktowane jako porady finansowe, inwestycyjne, tradingowe ani jakiekolwiek inne rekomendacje dostarczane lub zatwierdzone przez TradingView. Więcej informacji znajduje się w Warunkach użytkowania.
Wyłączenie odpowiedzialności
Informacje i publikacje nie stanowią i nie powinny być traktowane jako porady finansowe, inwestycyjne, tradingowe ani jakiekolwiek inne rekomendacje dostarczane lub zatwierdzone przez TradingView. Więcej informacji znajduje się w Warunkach użytkowania.