
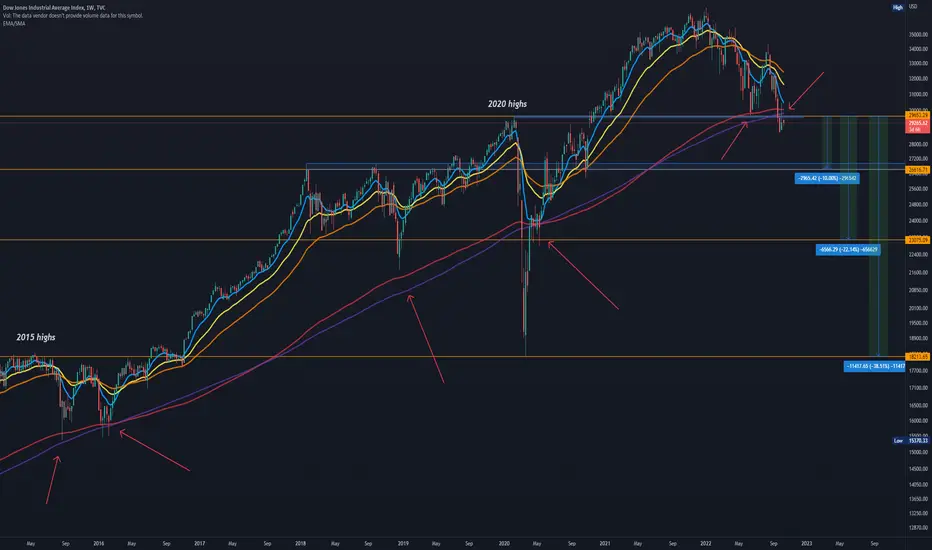
DJI = Dow Jones Industrial is not looking good.
200MA, 200EMA (which has worked as support before) and key level ~29 700 was tested and turned to resistance like it is seen on the graph.
Next target ~26 800 and if that gets broken ~23 000.
IF history repeats itself, then we might go test the 18 200 levels which happened last time 200MA turned to resistance (2008)
This analysis is invalid if we break ~29 700-30 000 and get on top of the EMAs
When Fed pivots and start to print money again the markets will turn, and the markets are probably going to sniff that before it actually happens. I think it's sooner than we expect.
-Jebu
200MA, 200EMA (which has worked as support before) and key level ~29 700 was tested and turned to resistance like it is seen on the graph.
Next target ~26 800 and if that gets broken ~23 000.
IF history repeats itself, then we might go test the 18 200 levels which happened last time 200MA turned to resistance (2008)
This analysis is invalid if we break ~29 700-30 000 and get on top of the EMAs
When Fed pivots and start to print money again the markets will turn, and the markets are probably going to sniff that before it actually happens. I think it's sooner than we expect.
-Jebu
Uwaga
Here we can see what happened 2002 and 2008 after 200EMA or MA was turned to resistance
Also some turning points of the price

Powiązane publikacje
Wyłączenie odpowiedzialności
Informacje i publikacje nie stanowią i nie powinny być traktowane jako porady finansowe, inwestycyjne, tradingowe ani jakiekolwiek inne rekomendacje dostarczane lub zatwierdzone przez TradingView. Więcej informacji znajduje się w Warunkach użytkowania.
Powiązane publikacje
Wyłączenie odpowiedzialności
Informacje i publikacje nie stanowią i nie powinny być traktowane jako porady finansowe, inwestycyjne, tradingowe ani jakiekolwiek inne rekomendacje dostarczane lub zatwierdzone przez TradingView. Więcej informacji znajduje się w Warunkach użytkowania.