
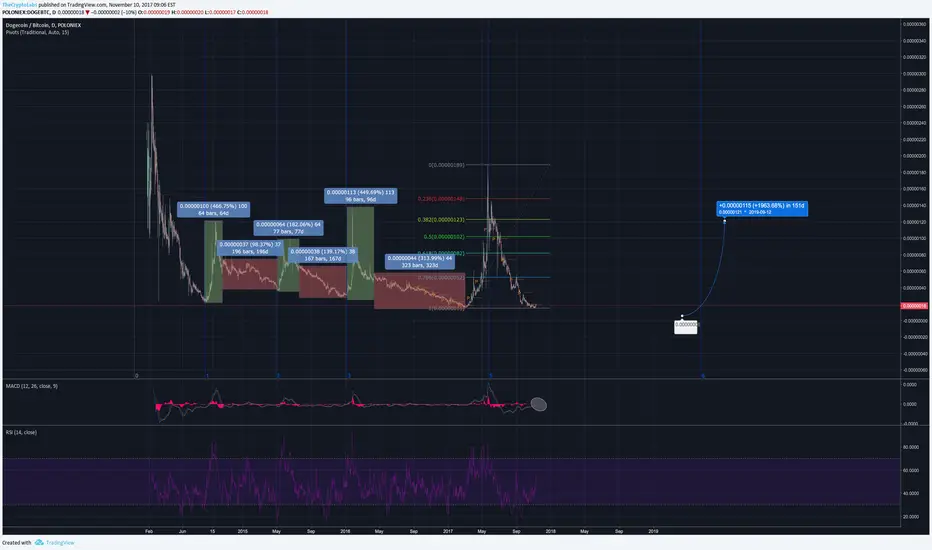
As you can see by the chart, every few months or so, our DOGE decides to wake up, pop, and go back to sleep for 2-3X the length of the "pop".
After every peak, it tends to slowly go down and fall around 15-20% less than where it started.
You can use fib retracement on the higher high and lower low to see.
I used fib timeframe to see if I could spot patterns and seems the lines align with the beginning of cycles, all 4 of them.
It shows the next fib timeframe at January / February 2018.
Stay on the lookout for this trade.
Set alerts & get ready to buy a small bag of dogecoin.
Uwaga
Thank me at:thecryptolabs.com

Wyłączenie odpowiedzialności
Informacje i publikacje nie stanowią i nie powinny być traktowane jako porady finansowe, inwestycyjne, tradingowe ani jakiekolwiek inne rekomendacje dostarczane lub zatwierdzone przez TradingView. Więcej informacji znajduje się w Warunkach użytkowania.
Wyłączenie odpowiedzialności
Informacje i publikacje nie stanowią i nie powinny być traktowane jako porady finansowe, inwestycyjne, tradingowe ani jakiekolwiek inne rekomendacje dostarczane lub zatwierdzone przez TradingView. Więcej informacji znajduje się w Warunkach użytkowania.