Long
EMC2 Post pump, possible continuation.
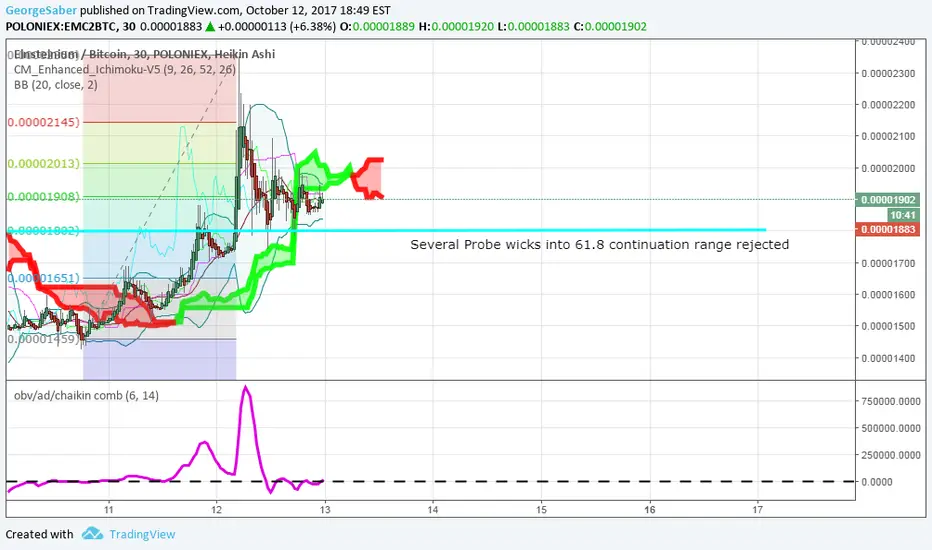
Last night's unexpected pump left EMC2 trading above 61.8 fib, continuation level;
Several probe wicks into 61.8 where rejected and eaten up.
I entered this trade just now, hoping for a continuation.
Chart appears to be at a volatile level, with Bollinger Bands tightening on the 30min time frame.
2hour chart shows all candles closing above red OBV chart; hence Bullish.
Yesterday's pump showed massive bullish wicks, and volume on bittrex is at 1700
OBV showing reduced selling/distribution.
I'm in and long; tell me if I'm wrong.

Wyłączenie odpowiedzialności
Informacje i publikacje nie stanowią i nie powinny być traktowane jako porady finansowe, inwestycyjne, tradingowe ani jakiekolwiek inne rekomendacje dostarczane lub zatwierdzone przez TradingView. Więcej informacji znajduje się w Warunkach użytkowania.
Wyłączenie odpowiedzialności
Informacje i publikacje nie stanowią i nie powinny być traktowane jako porady finansowe, inwestycyjne, tradingowe ani jakiekolwiek inne rekomendacje dostarczane lub zatwierdzone przez TradingView. Więcej informacji znajduje się w Warunkach użytkowania.