
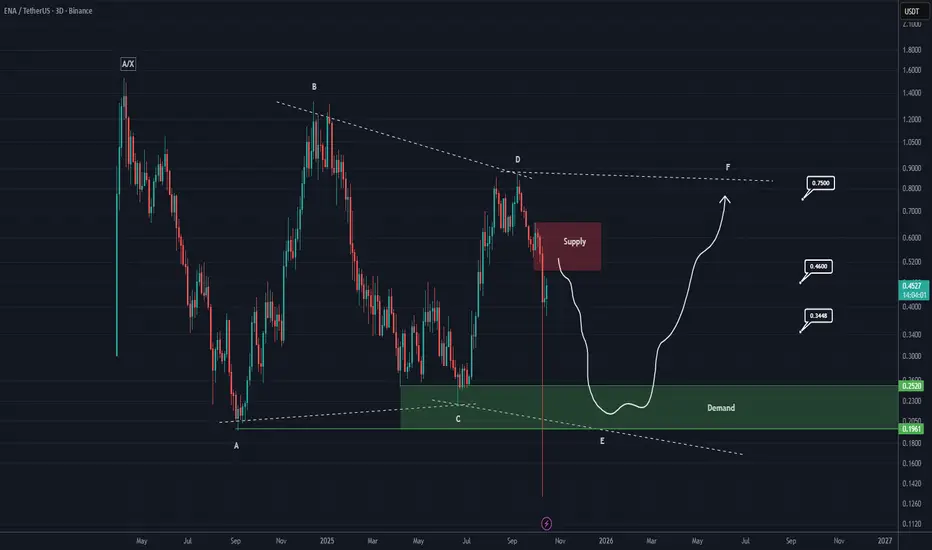
It seems that ENA is forming a corrective diametric pattern, where wave E can extend from the red zone to the green zone. This means the price may experience a time–price correction lasting for several months.
The targets for the next bullish wave are marked on the chart. These targets will take time to be reached.
This is the overall outlook for ENA on the higher timeframes.
For risk management, please don't forget stop loss and capital management
When we reach the first target, save some profit and then change the stop to entry
Comment if you have any questions
Thank You
Zlecenie aktywne
After hitting the red zone, the price has already corrected by more than 40%, and we hope you weren’t holding this coin at higher levels.We are looking for spot buying opportunities in the green zone.

✅ Join our Telegram channel to succeed in trading.
💎Our CRYPTO Telegram Channel: 👉 t.me/Behdark_EN
💎Our FOREX Telegram Channel: 👉 t.me/FX_Behdark
💎Our CRYPTO Telegram Channel: 👉 t.me/Behdark_EN
💎Our FOREX Telegram Channel: 👉 t.me/FX_Behdark
Wyłączenie odpowiedzialności
Informacje i publikacje nie stanowią i nie powinny być traktowane jako porady finansowe, inwestycyjne, tradingowe ani jakiekolwiek inne rekomendacje dostarczane lub zatwierdzone przez TradingView. Więcej informacji znajduje się w Warunkach użytkowania.