
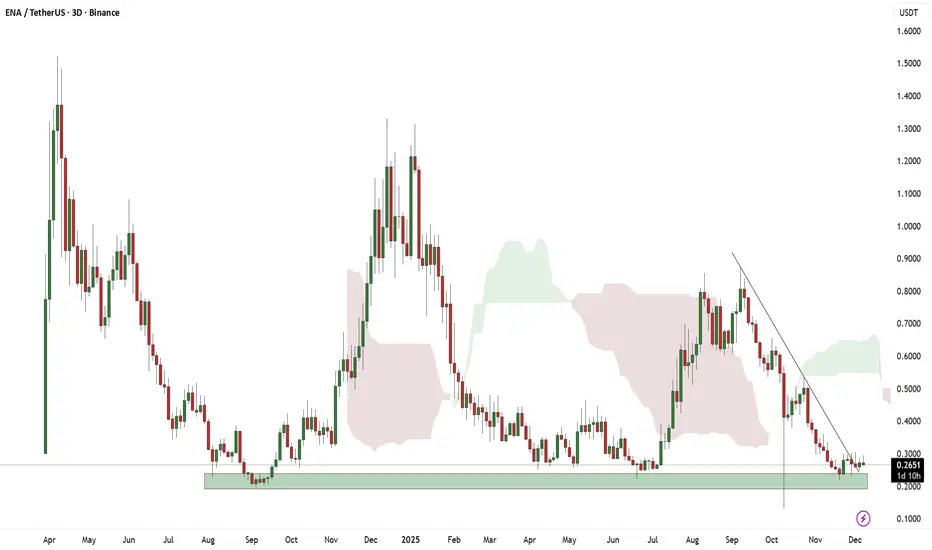
On the 3-day chart, ENA/USDT is trading inside a long-term demand zone where price has reacted multiple times in the past, showing that buyers have stepped in here before. The market has been in a downtrend for several months and is still moving under a descending trendline, showing weak momentum overall, but it is also holding above the same support area that previously triggered a strong bounce. Candles are small and volume looks low, which shows indecision, and the price is moving sideways near the bottom of the range instead of breaking down or starting a strong move yet. Until a clear move happens, the chart is showing consolidation near support after a long decline, meaning the market is in a waiting phase where buyers and sellers are trying to take control.

SpyOnGems (Mayank) | Technical Analysis & Education | Telegram: t.me/spyongems
Wyłączenie odpowiedzialności
Informacje i publikacje nie stanowią i nie powinny być traktowane jako porady finansowe, inwestycyjne, tradingowe ani jakiekolwiek inne rekomendacje dostarczane lub zatwierdzone przez TradingView. Więcej informacji znajduje się w Warunkach użytkowania.
SpyOnGems (Mayank) | Technical Analysis & Education | Telegram: t.me/spyongems
Wyłączenie odpowiedzialności
Informacje i publikacje nie stanowią i nie powinny być traktowane jako porady finansowe, inwestycyjne, tradingowe ani jakiekolwiek inne rekomendacje dostarczane lub zatwierdzone przez TradingView. Więcej informacji znajduje się w Warunkach użytkowania.