
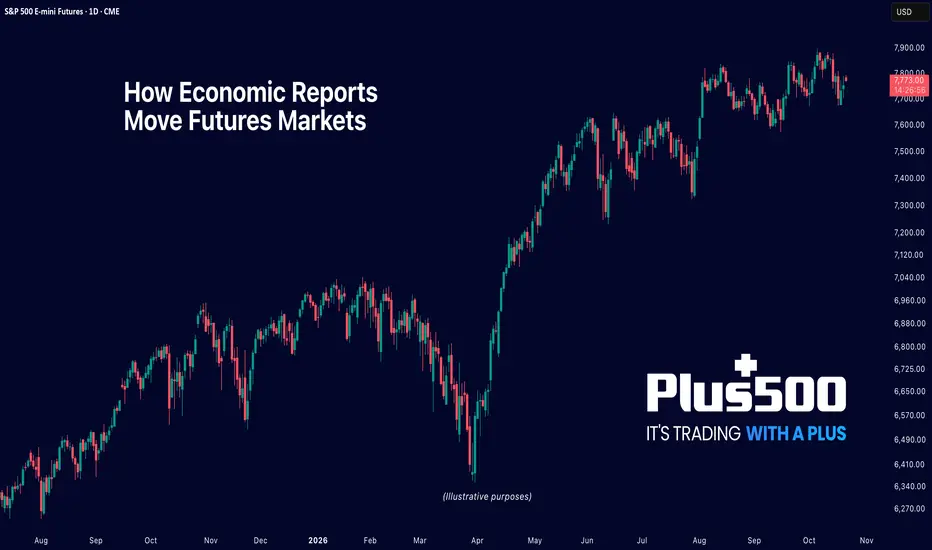
A handful of government reports produce more price movement in futures markets than almost any other recurring event. The moves can be large, fast, and in either direction.
Markets are constantly pricing expectations. When economic data confirms those expectations, the reaction may be limited. When the data surprises the market, prices can revalue in seconds.
For futures traders, understanding these scheduled releases is essential. Reports like the Consumer Price Index (CPI), Non-Farm Payrolls (NFP), and Federal Reserve interest rate decisions can significantly alter expectations for inflation, growth, and monetary policy, three forces that directly influence futures markets. These events are scheduled weeks or months in advance.
Today, we’ll see how CPI, Non-Farm Payrolls, and FOMC decisions affect futures markets, why volatility expands around release windows, and which contracts react most to each report.
📌 Why Scheduled Data Releases Create Volatility
Futures prices reflect the market's collective expectation of future conditions. Before a scheduled economic release, that expectation is already embedded in the price. When the actual number matches what the market expected, the reaction is often muted. When it diverges from consensus, the market reprices quickly.
Consensus estimates are published by financial data providers ahead of each major release. They aggregate economist forecasts into a single expected figure. The gap between that expected figure and the actual result drives the post-release move.
A larger gap produces a larger move. The direction depends on whether the surprise is positive or negative relative to market expectations.
📌 CPI: Consumer Price Index

(For illustrative purposes)
CPI is published monthly by the Bureau of Labor Statistics at 8:30 AM Eastern Time. It measures the change in prices paid by consumers across a basket of goods and services.
Futures traders track CPI because it influences Federal Reserve rate policy. A hotter-than-expected print raises the probability that the Fed will keep rates higher for longer. That probability shift reaches equity futures through a specific channel: higher expected rates raise the discount rate applied to future earnings, which compresses equity valuations.
Hypothetical example: If consensus expects CPI at 3.0% and the print comes in at 3.4%, the market reprices the likelihood of near-term Fed rate cuts. ES and NQ move to reflect the revised rate path. The 0.4 percentage point surprise (not the 3.4% figure itself) is what the market reacts to.
📌 NFP: Non-Farm Payrolls

(For illustrative purposes)
NFP is released on the first Friday of each month at 8:30 AM Eastern. It reports the net change in employment excluding farm workers, government, and a few other categories.
Three figures arrive simultaneously: the headline jobs number, the unemployment rate, and average hourly earnings. All three affect the market reaction, and they can pull in different directions.
Hypothetical example: If headline payrolls prints 280,000 against a consensus of 190,000, but average hourly earnings rise 0.5% month-on-month against 0.3% expected, the market faces competing signals. Strong employment supports growth expectations. Strong wage growth raises inflation expectations. The net effect on futures depends on which channel the market weights more heavily in the current rate environment.
📌 FOMC Decisions

(For illustrative purposes)
The FOMC meets approximately eight times per year and sets the federal funds rate target. At the conclusion of each meeting, it releases a policy statement. Quarterly meetings (held in March, June, September, and December) add a Summary of Economic Projections and a press conference.
The rate decision itself is typically anticipated well before announcement, based on prior Fed communication through speeches and minutes. The larger price moves usually come from the statement language and the press conference.
The Summary of Economic Projections includes a rate path chart (the dot plot), showing where each committee member projects rates to go over the next several years. When the dot plot shifts relative to the prior quarter's projection, the implied rate path changes.
Futures markets reprice that path in real time during the press conference as the Chair's language on inflation, employment, and future meeting intentions carries new information the rate decision alone does not.
📌 Volatility Before and After Releases
In the 5–10 minutes before a major release, liquidity typically thins. Market makers pull back their visible size. Bid-ask spreads may widen. This reflects the risk of being adversely selected when the number prints.
After the release, price can reprice several points in under a second in ES. Algorithmic systems parse the headline figure and route orders before most manual traders read the first number.
📌 Risk Around News Events
Position exposure during a major scheduled release is structurally different from the same position on a quiet session. Stop orders are not guaranteed to execute at the stated price in fast-moving markets. When triggered, they become market orders and fill at whatever price is available. During a 30-point repricing in ES, the available price can be far from the intended stop level.
Bid-ask spreads widen before release and normalize after the initial repricing. Execution costs are higher during that window than at any other point in the session.
The release schedule is public. The consensus estimates are published in advance. What remains unknown is the size and direction of the surprise gap, and how the market weights the data given the macro context at that moment.
📌 Important Considerations
📌 Key Takeaways
– Team Plus500
📌 Disclaimer
IMPORTANT: Trading in futures and options carries substantial risk of loss and is not suitable for every investor. The valuation of futures and options contracts may fluctuate rapidly and unpredictably, and, as a result, clients may lose more than their original investments. In no event should the content of this website be construed as an express or implied promise or guarantee by or from Plus500US Financial Services LLC that you will profit or that losses can or will be limited in any manner whatsoever. Market volatility, trade volume, and system availability may delay account access and trade executions. Past results are no indication of future performance. Information provided in this correspondence is intended solely for informational purposes and is obtained from sources believed to be reliable. Information is in no way guaranteed. The trading of futures is available through Plus500US Financial Services LLC d/b/a Plus500, a Futures Commission Merchant registered with the US Commodity Futures Trading Commission and a member of the National Futures Association (NFA ID number 0001398). Plus500US Financial Services LLC is a wholly-owned subsidiary of Plus500US Inc. Trading privileges subject to review and approval. Not all applicants will qualify. Information collected on account applications will be used to verify an applicant’s identity, as required under Federal law.
Markets are constantly pricing expectations. When economic data confirms those expectations, the reaction may be limited. When the data surprises the market, prices can revalue in seconds.
For futures traders, understanding these scheduled releases is essential. Reports like the Consumer Price Index (CPI), Non-Farm Payrolls (NFP), and Federal Reserve interest rate decisions can significantly alter expectations for inflation, growth, and monetary policy, three forces that directly influence futures markets. These events are scheduled weeks or months in advance.
Today, we’ll see how CPI, Non-Farm Payrolls, and FOMC decisions affect futures markets, why volatility expands around release windows, and which contracts react most to each report.
📌 Why Scheduled Data Releases Create Volatility
Futures prices reflect the market's collective expectation of future conditions. Before a scheduled economic release, that expectation is already embedded in the price. When the actual number matches what the market expected, the reaction is often muted. When it diverges from consensus, the market reprices quickly.
Consensus estimates are published by financial data providers ahead of each major release. They aggregate economist forecasts into a single expected figure. The gap between that expected figure and the actual result drives the post-release move.
A larger gap produces a larger move. The direction depends on whether the surprise is positive or negative relative to market expectations.
📌 CPI: Consumer Price Index
(For illustrative purposes)
CPI is published monthly by the Bureau of Labor Statistics at 8:30 AM Eastern Time. It measures the change in prices paid by consumers across a basket of goods and services.
Futures traders track CPI because it influences Federal Reserve rate policy. A hotter-than-expected print raises the probability that the Fed will keep rates higher for longer. That probability shift reaches equity futures through a specific channel: higher expected rates raise the discount rate applied to future earnings, which compresses equity valuations.
Hypothetical example: If consensus expects CPI at 3.0% and the print comes in at 3.4%, the market reprices the likelihood of near-term Fed rate cuts. ES and NQ move to reflect the revised rate path. The 0.4 percentage point surprise (not the 3.4% figure itself) is what the market reacts to.
📌 NFP: Non-Farm Payrolls
(For illustrative purposes)
NFP is released on the first Friday of each month at 8:30 AM Eastern. It reports the net change in employment excluding farm workers, government, and a few other categories.
Three figures arrive simultaneously: the headline jobs number, the unemployment rate, and average hourly earnings. All three affect the market reaction, and they can pull in different directions.
Hypothetical example: If headline payrolls prints 280,000 against a consensus of 190,000, but average hourly earnings rise 0.5% month-on-month against 0.3% expected, the market faces competing signals. Strong employment supports growth expectations. Strong wage growth raises inflation expectations. The net effect on futures depends on which channel the market weights more heavily in the current rate environment.
📌 FOMC Decisions
(For illustrative purposes)
The FOMC meets approximately eight times per year and sets the federal funds rate target. At the conclusion of each meeting, it releases a policy statement. Quarterly meetings (held in March, June, September, and December) add a Summary of Economic Projections and a press conference.
The rate decision itself is typically anticipated well before announcement, based on prior Fed communication through speeches and minutes. The larger price moves usually come from the statement language and the press conference.
The Summary of Economic Projections includes a rate path chart (the dot plot), showing where each committee member projects rates to go over the next several years. When the dot plot shifts relative to the prior quarter's projection, the implied rate path changes.
Futures markets reprice that path in real time during the press conference as the Chair's language on inflation, employment, and future meeting intentions carries new information the rate decision alone does not.
📌 Volatility Before and After Releases
In the 5–10 minutes before a major release, liquidity typically thins. Market makers pull back their visible size. Bid-ask spreads may widen. This reflects the risk of being adversely selected when the number prints.
After the release, price can reprice several points in under a second in ES. Algorithmic systems parse the headline figure and route orders before most manual traders read the first number.
📌 Risk Around News Events
Position exposure during a major scheduled release is structurally different from the same position on a quiet session. Stop orders are not guaranteed to execute at the stated price in fast-moving markets. When triggered, they become market orders and fill at whatever price is available. During a 30-point repricing in ES, the available price can be far from the intended stop level.
Bid-ask spreads widen before release and normalize after the initial repricing. Execution costs are higher during that window than at any other point in the session.
The release schedule is public. The consensus estimates are published in advance. What remains unknown is the size and direction of the surprise gap, and how the market weights the data given the macro context at that moment.
📌 Important Considerations
- Economic data releases can produce significantly higher volatility than normal trading sessions. Intraday ranges on release days can be multiples of the typical daily range.
- Stop orders are not guaranteed to fill at the stop price in fast-moving markets. Slippage during major releases can be substantial.
- Bid-ask spreads typically widen in the minutes before a scheduled release and normalize after the initial repricing. Execution costs are higher during this window.
- The same data print can produce different market reactions at different points in the rate cycle. A CPI print that was significant six months ago may produce a smaller reaction if the macro context has shifted.
📌 Key Takeaways
- Futures markets price in expected outcomes before a scheduled release. The post-release move is driven by the gap between the actual result and consensus, not the headline number itself.
- CPI surprises transmit to equity futures through the earnings-discount channel: a higher-than-expected inflation print raises the probability of sustained higher rates, which compresses equity valuations.
- NFP releases three figures simultaneously: headline jobs, unemployment rate, and average hourly earnings. All three affect the reaction, and they can pull in opposing directions.
- FOMC rate decisions are typically anticipated. The larger moves usually come from the dot plot and press conference, where the Chair's language on the future rate path carries information the rate decision alone does not.
- Bid-ask spreads widen and liquidity thins in the 5–10 minutes before a major release. Execution costs and stop slippage risk are structurally higher in that window than at any other point in the session.
- The same data print can produce different reactions at different points in the rate cycle. The macro context shapes how the market interprets the surprise gap.
– Team Plus500
📌 Disclaimer
IMPORTANT: Trading in futures and options carries substantial risk of loss and is not suitable for every investor. The valuation of futures and options contracts may fluctuate rapidly and unpredictably, and, as a result, clients may lose more than their original investments. In no event should the content of this website be construed as an express or implied promise or guarantee by or from Plus500US Financial Services LLC that you will profit or that losses can or will be limited in any manner whatsoever. Market volatility, trade volume, and system availability may delay account access and trade executions. Past results are no indication of future performance. Information provided in this correspondence is intended solely for informational purposes and is obtained from sources believed to be reliable. Information is in no way guaranteed. The trading of futures is available through Plus500US Financial Services LLC d/b/a Plus500, a Futures Commission Merchant registered with the US Commodity Futures Trading Commission and a member of the National Futures Association (NFA ID number 0001398). Plus500US Financial Services LLC is a wholly-owned subsidiary of Plus500US Inc. Trading privileges subject to review and approval. Not all applicants will qualify. Information collected on account applications will be used to verify an applicant’s identity, as required under Federal law.

It's futures trading with a plus
Powiązane publikacje
Wyłączenie odpowiedzialności
Informacje i publikacje nie stanowią i nie powinny być traktowane jako porady finansowe, inwestycyjne, tradingowe ani jakiekolwiek inne rekomendacje dostarczane lub zatwierdzone przez TradingView. Więcej informacji znajduje się w Warunkach użytkowania.