
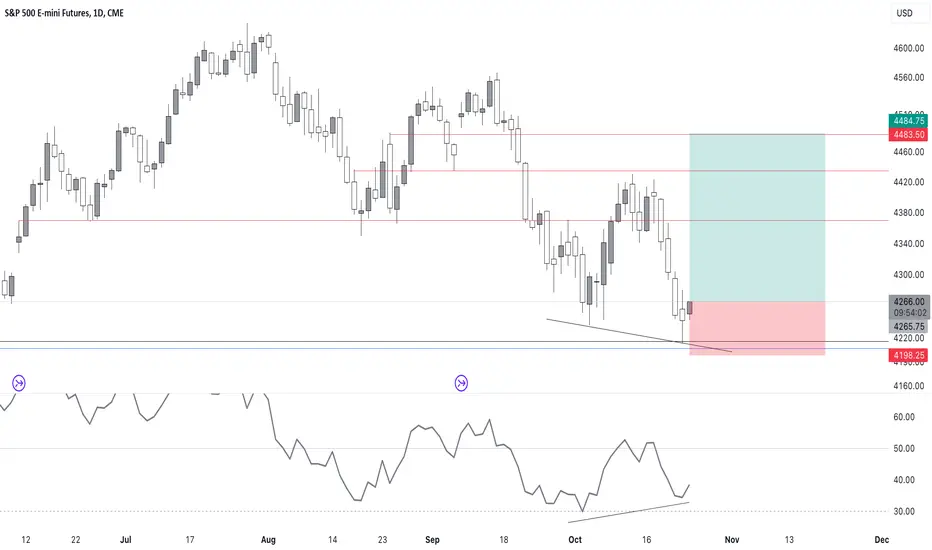
Hello traders, SPX charts looks bullish. We can see in the chart price forming a bullish reversal pattern backed with RSI bullish divergence on daily time frame. If this daily candle close like this, it means bullish engulfing candle formed and we are most likely to see a nice reaction to the up-side from here.
Entry price: here
Targets. above (red lines)
Stop loss: below wick
Good luck :)
Entry price: here
Targets. above (red lines)
Stop loss: below wick
Good luck :)

Wyłączenie odpowiedzialności
Informacje i publikacje nie stanowią i nie powinny być traktowane jako porady finansowe, inwestycyjne, tradingowe ani jakiekolwiek inne rekomendacje dostarczane lub zatwierdzone przez TradingView. Więcej informacji znajduje się w Warunkach użytkowania.
Wyłączenie odpowiedzialności
Informacje i publikacje nie stanowią i nie powinny być traktowane jako porady finansowe, inwestycyjne, tradingowe ani jakiekolwiek inne rekomendacje dostarczane lub zatwierdzone przez TradingView. Więcej informacji znajduje się w Warunkach użytkowania.