
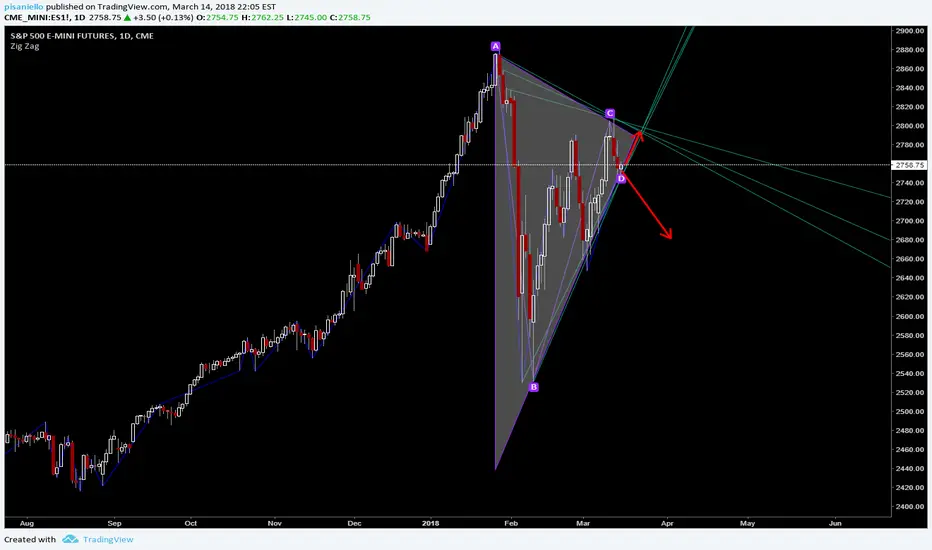
Which way will the ESM2018 go?
I attempted to draw chart trends from the recent correction in February, 2018 through present.
It appears there is a triangle chart pattern forming, but I am having trouble identifying whether it is bullish or bearish.
If it breaks below the bottom support of the triangle, I am short for a test of the recent lows.
If it bounces off of the bottom support of the triangle, I am long for 2800+ target.
Note - I also am using a squeeze indicator that is showing a 3 day period of tight volatility in the ESM2018.
I will base my position on the direction of momentum after this squeeze period comes to an end.
What do you think!?
KP
I attempted to draw chart trends from the recent correction in February, 2018 through present.
It appears there is a triangle chart pattern forming, but I am having trouble identifying whether it is bullish or bearish.
If it breaks below the bottom support of the triangle, I am short for a test of the recent lows.
If it bounces off of the bottom support of the triangle, I am long for 2800+ target.
Note - I also am using a squeeze indicator that is showing a 3 day period of tight volatility in the ESM2018.
I will base my position on the direction of momentum after this squeeze period comes to an end.
What do you think!?
KP

Wyłączenie odpowiedzialności
Informacje i publikacje nie stanowią i nie powinny być traktowane jako porady finansowe, inwestycyjne, tradingowe ani jakiekolwiek inne rekomendacje dostarczane lub zatwierdzone przez TradingView. Więcej informacji znajduje się w Warunkach użytkowania.
Wyłączenie odpowiedzialności
Informacje i publikacje nie stanowią i nie powinny być traktowane jako porady finansowe, inwestycyjne, tradingowe ani jakiekolwiek inne rekomendacje dostarczane lub zatwierdzone przez TradingView. Więcej informacji znajduje się w Warunkach użytkowania.