
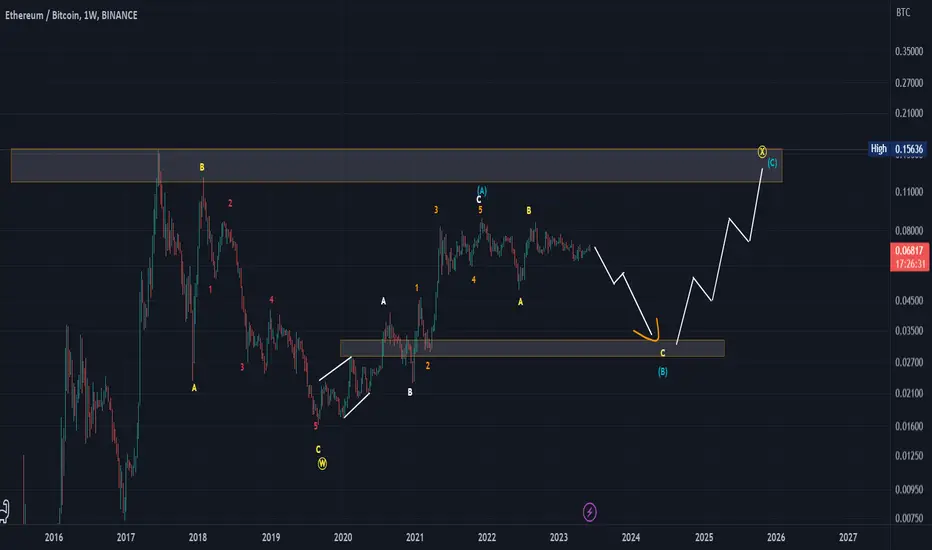
This is now the general direction of the Bitcoin Ether chart, and when it reaches the shaded area below, it will head again to test the historical top in the shaded area above.
Note: This is a weekly chart, which means it will take some time to fall to the shaded area below, and the average time to rise again to test the shaded area above.
If this chart and dozens of other successful analyzes on my page helped you, please like and comment
Note: This is a weekly chart, which means it will take some time to fall to the shaded area below, and the average time to rise again to test the shaded area above.
If this chart and dozens of other successful analyzes on my page helped you, please like and comment
Zlecenie aktywne
Zlecenie aktywne
Zlecenie aktywne
Zlecenie aktywne

Powiązane publikacje
Wyłączenie odpowiedzialności
Informacje i publikacje nie stanowią i nie powinny być traktowane jako porady finansowe, inwestycyjne, tradingowe ani jakiekolwiek inne rekomendacje dostarczane lub zatwierdzone przez TradingView. Więcej informacji znajduje się w Warunkach użytkowania.
Powiązane publikacje
Wyłączenie odpowiedzialności
Informacje i publikacje nie stanowią i nie powinny być traktowane jako porady finansowe, inwestycyjne, tradingowe ani jakiekolwiek inne rekomendacje dostarczane lub zatwierdzone przez TradingView. Więcej informacji znajduje się w Warunkach użytkowania.