
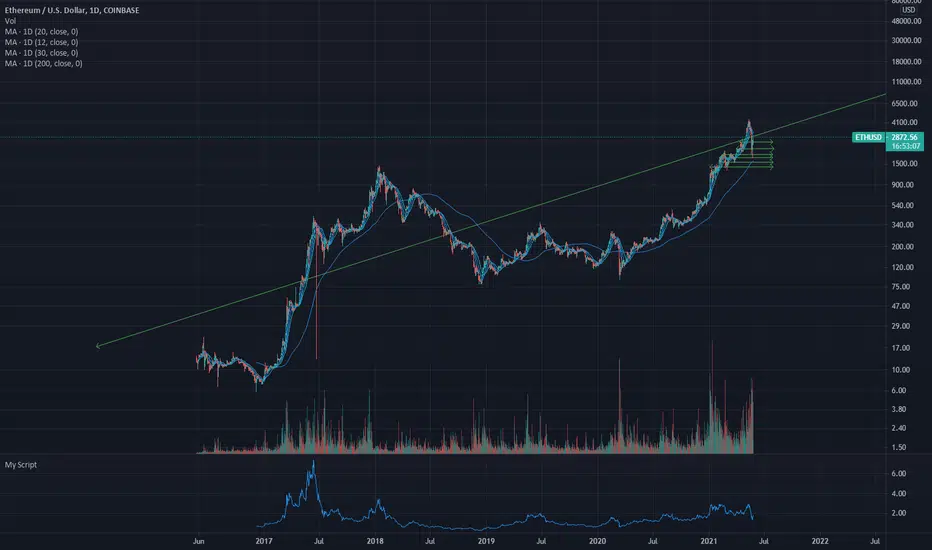
Over the long-term, ETH swings in a sine curve around a linear trend line on its log chart (the green line splitting through the middle of the wave). This line represents consistent, parabolic growth with substantial volatility.
Today, ETH is testing this critical long-term trend line.
If ETH breaks past the trend line upward, we're in for a swing up in a sine curve as impressive as the last bull market of 2017-2018. But if ETH cannot break through this resistance, the bull market may well fizzle out.
I am trading cautiously under the assumption that ETH will break well past this trend line. But that assumption still needs to prove itself.
Please do your own research and proceed cautiously. This analysis is educational only.
Today, ETH is testing this critical long-term trend line.
If ETH breaks past the trend line upward, we're in for a swing up in a sine curve as impressive as the last bull market of 2017-2018. But if ETH cannot break through this resistance, the bull market may well fizzle out.
I am trading cautiously under the assumption that ETH will break well past this trend line. But that assumption still needs to prove itself.
Please do your own research and proceed cautiously. This analysis is educational only.

Wyłączenie odpowiedzialności
Informacje i publikacje nie stanowią i nie powinny być traktowane jako porady finansowe, inwestycyjne, tradingowe ani jakiekolwiek inne rekomendacje dostarczane lub zatwierdzone przez TradingView. Więcej informacji znajduje się w Warunkach użytkowania.
Wyłączenie odpowiedzialności
Informacje i publikacje nie stanowią i nie powinny być traktowane jako porady finansowe, inwestycyjne, tradingowe ani jakiekolwiek inne rekomendacje dostarczane lub zatwierdzone przez TradingView. Więcej informacji znajduje się w Warunkach użytkowania.