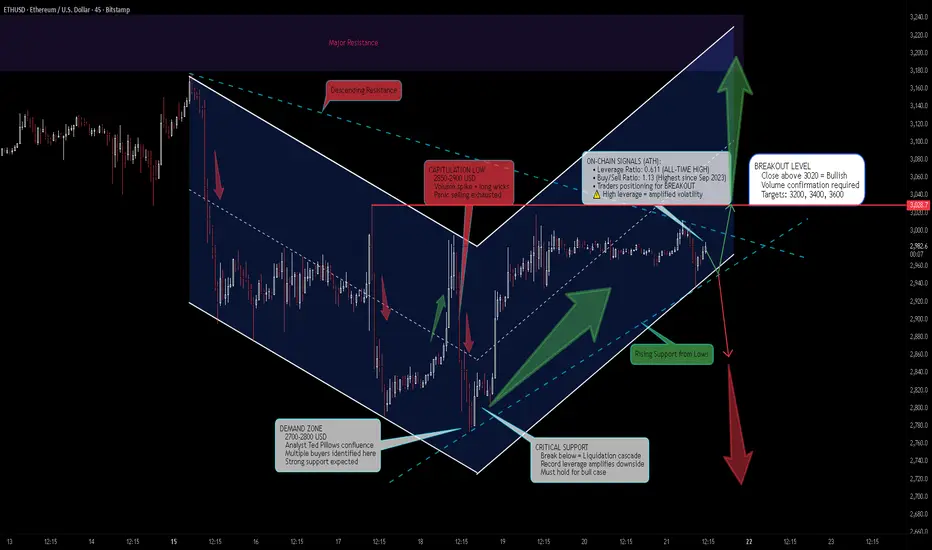
 ETHUSD is trading at approximately 2976 USD after a sharp 28 percent correction from the December 14-15 highs near 3980 USD to the December 18-19 lows around 2850 USD. While the hawkish Federal Reserve meeting triggered this selloff, on-chain data is flashing unprecedented bullish signals. Binance's Estimated Leverage Ratio just hit an ALL-TIME HIGH of 0.611, and the Taker Buy/Sell Ratio spiked to 1.13 - levels not seen since September 2023. Traders are positioning aggressively for upside. The question now: is the capitulation complete, or does high leverage create liquidation risk?
Current Market Context - December 21, 2025
Ethereum experienced one of its sharpest weekly declines in recent months, dropping from nearly 4000 USD to below 2900 USD in just four days. The catalyst was the Federal Reserve December 18 meeting where the central bank delivered a more hawkish stance than markets anticipated, projecting only two rate cuts for 2026.
The selloff was exacerbated by:
- Broad risk-off sentiment across all crypto assets
- Bitcoin dropping from 108000 USD to below 92000 USD
- Over 1 billion USD in crypto liquidations within 24 hours
- Ethereum ETF outflows as institutional investors reduced exposure
- Year-end profit taking and portfolio rebalancing
However, the bounce from 2850 USD and current stabilization around 2976 USD suggests the initial panic selling may be exhausted. More importantly, on-chain metrics are telling a different story than price action.
CRITICAL ON-CHAIN DATA - Record Bullish Positioning
Estimated Leverage Ratio - ALL-TIME HIGH
Data from CryptoQuant shows Ethereum's Estimated Leverage Ratio on Binance has climbed to 0.611 - the highest level EVER recorded for this metric. This ratio compares open interest to exchange reserves, revealing how much borrowed capital traders are deploying relative to available liquidity.
What this means:
- Traders are committing record leveraged positions anticipating favorable price movement
- Current reading surpasses ALL previous cycle peaks
- This environment amplifies price moves - modest spot changes can trigger large liquidations
- Risk appetite among traders is at unprecedented levels
Taker Buy/Sell Ratio - Highest Since September 2023
The Taker Buy/Sell Ratio recently spiked to 1.13 on Binance - a level last observed in September 2023. A reading above 1 indicates market participants are executing more buy orders than sell orders.
- Strong taker demand combined with rising leverage reveals optimism dominating short-term sentiment
- Historical data shows spikes in this ratio often coincide with increased volatility
- Traders are positioning ahead of a potential attempt to reclaim 3000 USD
- This buying pressure is notable given ETH is trading around 2900-3000 USD
WARNING: While these metrics are bullish, record leverage is a double-edged sword. If price moves against leveraged positions, liquidation cascades can accelerate downside moves dramatically.
Technical Structure Analysis
Price Action Overview - 45 Minute Timeframe
Analyzing the chart from December 14-21, 2025:
Phase 1 - Distribution and Initial Decline (Dec 14-16):
- Price peaked near 3980 USD on December 14
- Initial breakdown below 3900 USD signaled distribution
- Steady decline through 3800, 3700, 3600 levels
- Lower highs forming on each bounce attempt
- Volume increasing on down moves - classic distribution signature
Phase 2 - Capitulation Event (Dec 17-19):
- Sharp acceleration of selling on December 17-18
- Price crashed through multiple support levels without pause
- Breakdown from 3400 to 2850 USD in approximately 36 hours
- This represented a 16 percent drop in less than two days
- Capitulation volume spike visible on the December 18-19 lows
- Long wicks on candles near 2850 USD showing buyer absorption
Phase 3 - Stabilization and Accumulation (Dec 19-21):
- Strong bounce from 2850 USD low
- Price recovered to 2976 USD representing 4.4 percent recovery from lows
- Higher lows forming: 2850 to 2880 to 2920 to current levels
- Consolidation range establishing between 2950-3000 USD
- Decreasing volatility suggesting selling pressure exhaustion
- On-chain data confirms accumulation phase is active
Key Support and Resistance Levels
Resistance Levels:
- 3000-3020 USD - Immediate psychological resistance and round number
- 3080-3100 USD - Previous support turned resistance from December 17
- 3200-3250 USD - Major horizontal resistance zone
- 3400-3450 USD - Secondary resistance from pre-crash consolidation
- 3600-3650 USD - Major resistance zone
- 3900-4000 USD - December highs and psychological barrier
Support Levels:
- 2950-2960 USD - Immediate support from current consolidation
- 2900-2920 USD - Recent higher low support
- 2850-2870 USD - Capitulation low and critical support
- 2700-2800 USD - MAJOR DEMAND ZONE (Analyst Confluence)
- 2600-2650 USD - Deep support from November 2025 levels
The 2700-2800 Demand Zone - Analyst Confluence
Crypto analyst Ted Pillows has outlined a clear technical roadmap identifying the 2700-2800 USD zone as a major demand area. According to his analysis, ETH recently tapped into this important demand zone and has started to rebound. This move occurred when Ethereum broke below 3000 USD to reach a low of 2781 USD on December 18.
Multiple analysts are highlighting this zone as critical support with strong buyer interest. The fact that price bounced sharply from this area and on-chain metrics show record bullish positioning suggests smart money is accumulating here.
Chart Pattern Analysis
The current structure shows characteristics of a potential falling wedge pattern:
- Lower highs connecting from 3980 to 3400 to 3100 area
- Lower lows from 3600 to 3000 to 2850
- However, the most recent price action shows higher lows forming off 2850
- This divergence between lower highs and higher lows creates compression
- Breakout direction will determine next major move
- Falling wedges typically resolve to the upside
Fibonacci Retracement Analysis
Measuring from the November 2025 low (approximately 2400 USD) to the December 2025 high (3980 USD):
- 0.236 retracement: 3607 USD - Already broken
- 0.382 retracement: 3376 USD - Already broken
- 0.5 retracement: 3190 USD - Already broken
- 0.618 retracement: 3004 USD - Currently testing this level
- 0.786 retracement: 2739 USD - Held as support (low was 2850)
The bounce from near the 0.786 Fibonacci level is significant. This deep retracement level often marks the end of corrections in strong trends. The current test of the 0.618 level (3004 USD) will be crucial - a reclaim would be bullish, rejection would suggest more downside.
Fundamental Analysis
Federal Reserve Impact
The December 18, 2025 FOMC meeting was the primary catalyst for the selloff:
- Fed held rates steady but projected only two rate cuts for 2026
- Markets had priced in three to four cuts, creating hawkish surprise
- Fed Chair emphasized data dependency and willingness to maintain restrictive policy
- Higher-for-longer rates increase opportunity cost of holding crypto assets
- Risk assets across the board sold off following the announcement
Altcoin Season Approaching - January 2026
A growing number of market analysts believe the long-awaited altcoin season may finally arrive in January 2026, with new data suggesting a shift in liquidity conditions. Ethereum's market behavior has attracted analysts who are highlighting a shift in leadership, typically seen only after a strong Bitcoin rally.
This is significant because:
- Bitcoin has already made its major move from 60K to 108K
- Capital rotation into altcoins typically follows BTC dominance peaks
- ETH historically leads altcoin rallies
- January sees fresh institutional allocations entering the market
Ethereum-Specific Fundamentals
Despite the price decline, Ethereum fundamentals remain constructive:
- Ethereum staking continues to grow with over 34 million ETH staked
- Layer 2 adoption accelerating with Base, Arbitrum, and Optimism seeing record activity
- Ethereum ETF infrastructure now established providing institutional access
- Pectra upgrade scheduled for Q1 2026 bringing account abstraction improvements
- DeFi Total Value Locked on Ethereum remains above 60 billion USD
Security Concerns - Risk Factor
The crypto space continues to face security challenges:
- December 20: A trader lost nearly 50 million USD in USDT to an address poisoning attack
- 2025 has seen over 3.4 billion USD in crypto thefts - a record year
- The February Bybit hack (1.4 billion USD) accounted for 44 percent of annual losses
- These incidents create headline risk and can spook retail investors
- However, institutional infrastructure and security practices continue improving
ETF Flow Analysis
Ethereum ETF flows have been mixed:
- December saw net outflows as institutions reduced risk exposure ahead of year-end
- The post-Fed selloff accelerated ETF redemptions
- However, long-term institutional interest remains intact
- January typically sees renewed institutional buying as new year allocations begin
- ETF structure provides easier access for institutions to re-enter on dips
Ethereum vs Bitcoin Analysis
The ETH/BTC ratio provides important context:
- ETH has underperformed BTC during this correction
- ETH/BTC ratio declined from 0.037 to 0.032 area
- This underperformance is typical during risk-off periods
- However, ETH tends to outperform during recovery phases
- Vitalik Buterin himself said years ago he would respect a technically competent rival - but none has emerged
- A stabilization in ETH/BTC would be early signal of ETH strength returning
Directional Bias Assessment
Arguments for Bullish Reversal:
- LEVERAGE RATIO AT ALL-TIME HIGH (0.611) - Record bullish positioning
- TAKER BUY/SELL RATIO AT 1.13 - Highest since September 2023
- Capitulation volume and price action suggest panic selling exhausted
- Bounce from 0.786 Fibonacci level is technically significant
- 2700-2800 demand zone confirmed by multiple analysts
- Higher lows forming off the 2850 USD bottom
- Exchange outflows during dip suggest accumulation occurring
- Altcoin season expected January 2026 per multiple analysts
- Strong fundamental backdrop with staking growth and L2 adoption
- Pectra upgrade catalyst approaching in Q1 2026
Arguments for Bearish Continuation:
- Price remains below all major moving averages
- No confirmed trend reversal pattern yet
- Fed hawkishness could continue pressuring risk assets
- RECORD LEVERAGE = LIQUIDATION RISK if price drops
- ETH underperforming BTC suggests relative weakness
- Holiday liquidity conditions could exacerbate any selling
- 3000 USD psychological resistance may cap rallies
- Security concerns (50M hack, 3.4B stolen in 2025) create headline risk
- ETF outflows may continue into year-end
My Assessment - Bullish with Leverage Caution:
The weight of evidence leans bullish. Record on-chain metrics showing unprecedented trader positioning for upside, combined with technical support holding and analyst confluence on the 2700-2800 demand zone, suggests the capitulation low should hold.
HOWEVER - the record leverage is a double-edged sword. If 2850 breaks, liquidation cascades could accelerate the move down significantly.
Bullish Confirmation: A daily close above 3050 USD with volume would confirm the bottom and open path to 3200-3400 USD.
Bearish Confirmation: A break below 2850 USD would trigger leveraged liquidations and open path to 2600-2750 USD.
Short-term (next 1-2 weeks): Bullish bias. On-chain data strongly supports upside. Expect attempt to reclaim 3000 USD and test 3200 USD.
Long-term (1-3 months): Bullish. Altcoin season catalyst in January, Pectra upgrade in Q1, and structural drivers intact. Targets of 3400-3600 USD valid for Q1 2026.
Trade Framework
Scenario 1: Bullish Breakout Trade
Entry Conditions:
- 45-minute candle closes decisively above 3020 USD
- Volume on breakout candle exceeds recent average
- RSI breaks above 55 confirming momentum shift
Trade Parameters:
Entry: 3025-3050 USD on confirmed breakout
Stop Loss: 2920 USD below recent higher low
Target 1: 3150-3200 USD previous support zone
Target 2: 3350-3400 USD major resistance
Target 3: 3550-3600 USD extended target
Risk-Reward: Approximately 1:2.5 to first target
Scenario 2: Buy the Dip at Demand Zone
Entry Conditions:
- Price retests 2700-2800 USD demand zone
- Bullish rejection candle with long lower wick
- RSI showing oversold bounce
- Volume spike on the bounce candle
Trade Parameters:
Entry: 2750-2800 USD on demand zone retest
Stop Loss: 2650 USD below demand zone
Target 1: 3000-3020 USD psychological resistance
Target 2: 3150-3200 USD major resistance
Target 3: 3350-3400 USD extended target
Risk-Reward: Approximately 1:3 to first target
Scenario 3: Bearish Breakdown Trade
Entry Conditions:
- 45-minute candle closes below 2850 USD
- Volume confirmation on breakdown
- Leverage liquidations begin cascading
Trade Parameters:
Entry: 2840-2850 USD on confirmed breakdown
Stop Loss: 2920 USD above recent consolidation
Target 1: 2750-2780 USD secondary support
Target 2: 2650-2700 USD major support
Target 3: 2500-2550 USD extended target
Risk-Reward: Approximately 1:2 to first target
Risk Management Guidelines
- Position sizing should not exceed 2-3 percent risk per trade
- CRITICAL: Record leverage means volatility will be amplified
- Reduce size during holiday period due to lower liquidity
- Use hard stop losses - liquidation cascades can move price fast
- Scale into positions using multiple entries rather than single entry
- Take partial profits at each target level (33 percent at each)
- Move stop to breakeven after first target achieved
- Monitor BTC price action as correlation remains high
Invalidation Levels
Bullish thesis invalidated if:
- Price closes below 2700 USD on 4-hour or daily timeframe
- Lower low forms below the December 18-19 capitulation low
- ETH/BTC ratio breaks to new lows below 0.030
- BTC breaks below 88000 USD triggering broader selloff
Bearish thesis invalidated if:
- Price closes above 3200 USD with volume
- Higher high forms above 3100 USD
- RSI breaks above 60 with momentum
- ETH/BTC ratio recovers above 0.036
Conclusion
ETHUSD has experienced a sharp 28 percent correction from the December highs near 3980 USD to the capitulation low around 2850 USD. While the Fed meeting triggered the selloff, on-chain data tells a powerfully bullish story.The Numbers That Matter:
- Leverage Ratio: 0.611 - ALL-TIME HIGH
- Taker Buy/Sell Ratio: 1.13 - Highest since September 2023
- Demand Zone: 2700-2800 USD - Multiple analyst confluence
- Fibonacci Support: 0.786 level held (2739 USD)
Key Levels to Watch:
- 3000-3020 USD - Breakout confirmation level
- 2850 USD - Critical support / capitulation low
- 2700-2800 USD - Major demand zone
- 3200 USD - Major resistance for trend confirmation
Trading Approach:
The on-chain data strongly favors bulls, but record leverage means you must respect risk management. Wait for either:
- Bullish breakout above 3020 USD with volume to confirm bottom
- Retest of 2700-2800 USD demand zone for lower-risk long entry
- Breakdown below 2850 USD to flip bearish (watch for liquidation cascade)
Altcoin season approaching in January 2026 provides a macro tailwind. The setup favors patient bulls who manage risk appropriately.
Drop your comments below on the next move for ETH!

The Institutional Grade Trading Ecosystem, Built to win trades 📈
Get Access 👇
jackofalltrades.vip 🌐
t.me/jackofalltradesvip 🃏
Get Access 👇
jackofalltrades.vip 🌐
t.me/jackofalltradesvip 🃏
Wyłączenie odpowiedzialności
Informacje i publikacje nie stanowią i nie powinny być traktowane jako porady finansowe, inwestycyjne, tradingowe ani jakiekolwiek inne rekomendacje dostarczane lub zatwierdzone przez TradingView. Więcej informacji znajduje się w Warunkach użytkowania.
The Institutional Grade Trading Ecosystem, Built to win trades 📈
Get Access 👇
jackofalltrades.vip 🌐
t.me/jackofalltradesvip 🃏
Get Access 👇
jackofalltrades.vip 🌐
t.me/jackofalltradesvip 🃏
Wyłączenie odpowiedzialności
Informacje i publikacje nie stanowią i nie powinny być traktowane jako porady finansowe, inwestycyjne, tradingowe ani jakiekolwiek inne rekomendacje dostarczane lub zatwierdzone przez TradingView. Więcej informacji znajduje się w Warunkach użytkowania.