
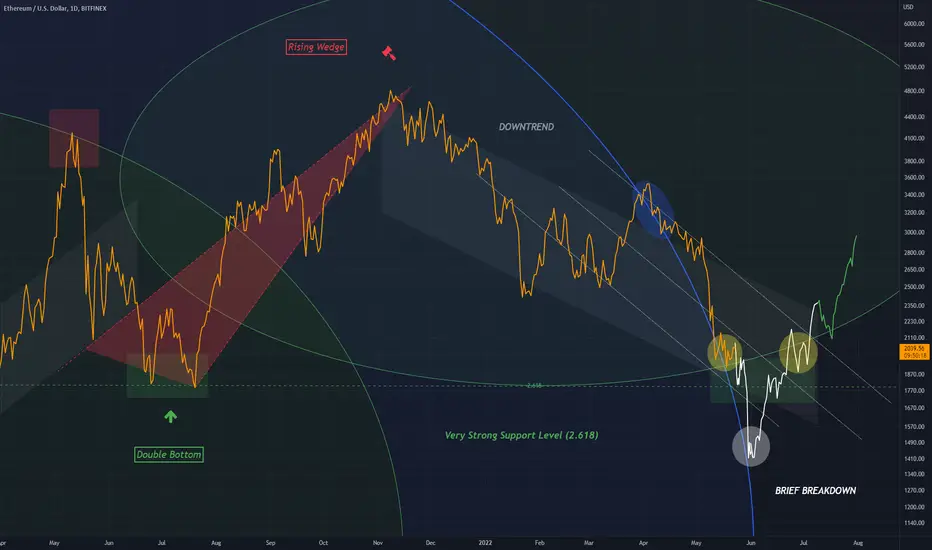
Price has almost reached the 2.618 level of a major Fibonacci circle area
As price reaches this level within the apparent downtrend, a breakdown may ensue vertically along the blue circle
After this event a prompt recover will follow, and this is when I believe the bulls will return in force.
Trend line drawn horizontally against 2.618 shows a double bottom formation which further emphasizes a bull rejection
Other patterns on the chart include a Rising Wedge which shows a clear top point
Price (bars pattern) placed around the 2.618 area are just estimations, the main takeaway is a recovery at 2.618.
Daily chart
I am long Ethereum
As price reaches this level within the apparent downtrend, a breakdown may ensue vertically along the blue circle
After this event a prompt recover will follow, and this is when I believe the bulls will return in force.
Trend line drawn horizontally against 2.618 shows a double bottom formation which further emphasizes a bull rejection
Other patterns on the chart include a Rising Wedge which shows a clear top point
Price (bars pattern) placed around the 2.618 area are just estimations, the main takeaway is a recovery at 2.618.
Daily chart
I am long Ethereum

Wyłączenie odpowiedzialności
Informacje i publikacje nie stanowią i nie powinny być traktowane jako porady finansowe, inwestycyjne, tradingowe ani jakiekolwiek inne rekomendacje dostarczane lub zatwierdzone przez TradingView. Więcej informacji znajduje się w Warunkach użytkowania.
Wyłączenie odpowiedzialności
Informacje i publikacje nie stanowią i nie powinny być traktowane jako porady finansowe, inwestycyjne, tradingowe ani jakiekolwiek inne rekomendacje dostarczane lub zatwierdzone przez TradingView. Więcej informacji znajduje się w Warunkach użytkowania.