
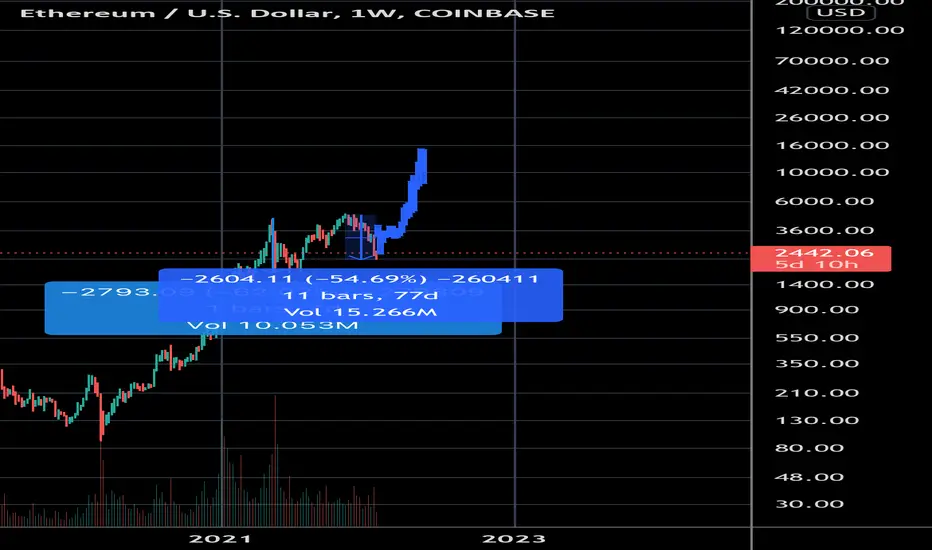
During the 2017 run up to the early 2018 blow off top, ETH had two “crashes” of -69% and -47%, before proceeding to do another 600% pump over a ~110 day period. During the recent cycle, we have experienced two “crashes” of -62% and -54% - if the same fractal / pattern plays out, $16,000 USD ETH can be on table by Q2 2022.

Wyłączenie odpowiedzialności
Informacje i publikacje nie stanowią i nie powinny być traktowane jako porady finansowe, inwestycyjne, tradingowe ani jakiekolwiek inne rekomendacje dostarczane lub zatwierdzone przez TradingView. Więcej informacji znajduje się w Warunkach użytkowania.
Wyłączenie odpowiedzialności
Informacje i publikacje nie stanowią i nie powinny być traktowane jako porady finansowe, inwestycyjne, tradingowe ani jakiekolwiek inne rekomendacje dostarczane lub zatwierdzone przez TradingView. Więcej informacji znajduje się w Warunkach użytkowania.