
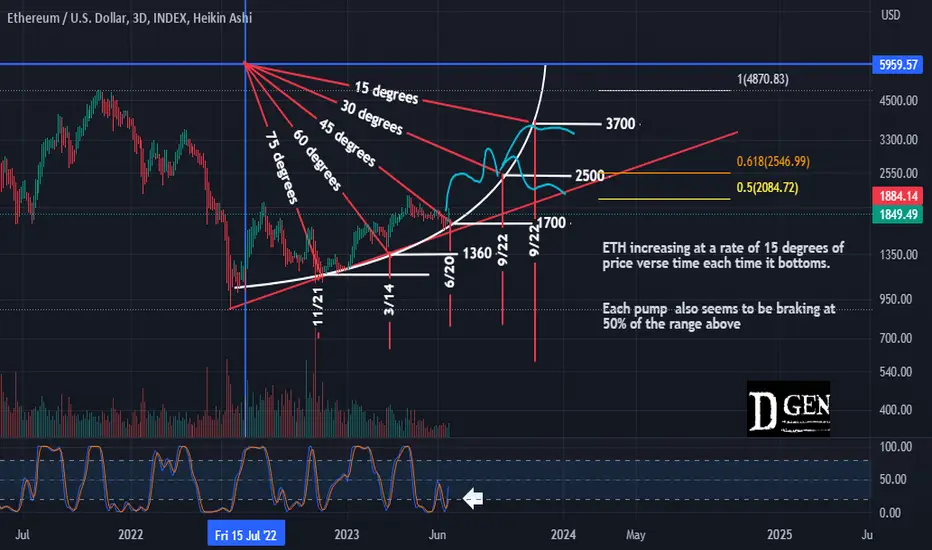
Looking at ETH on a log chart we can see that each time it has pulled back it has put in a higher bottom and each of these bottoms is exactly 15 degrees apart. This a clear indication that there a inreasing rate of momentum.
Each run since the last years bottom also seems to be braking at 50% of the range above.
If the pattern continues this would put the next uptrend target right into the technical golden pocket from the macro high.
At the same time WHEN the pattern brakes its over.
Each run since the last years bottom also seems to be braking at 50% of the range above.
If the pattern continues this would put the next uptrend target right into the technical golden pocket from the macro high.
At the same time WHEN the pattern brakes its over.
Uwaga
next stop 3700?
Wyłączenie odpowiedzialności
Informacje i publikacje nie stanowią i nie powinny być traktowane jako porady finansowe, inwestycyjne, tradingowe ani jakiekolwiek inne rekomendacje dostarczane lub zatwierdzone przez TradingView. Więcej informacji znajduje się w Warunkach użytkowania.
Wyłączenie odpowiedzialności
Informacje i publikacje nie stanowią i nie powinny być traktowane jako porady finansowe, inwestycyjne, tradingowe ani jakiekolwiek inne rekomendacje dostarczane lub zatwierdzone przez TradingView. Więcej informacji znajduje się w Warunkach użytkowania.