
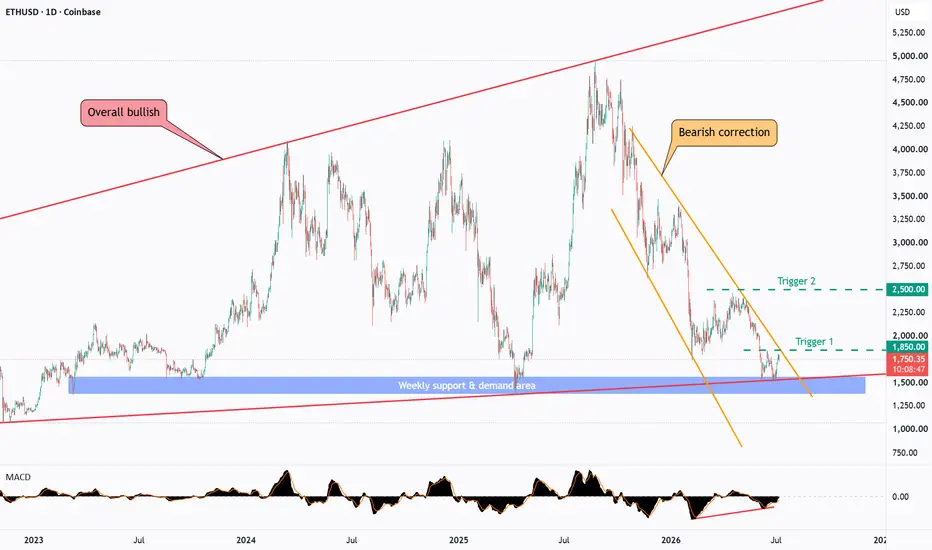
ETH remains overall bullish from a long-term perspective, continuing to respect the red ascending broadening wedge on the weekly and monthly timeframes.
Over the past year, price has been moving through a corrective phase inside the orange descending channel. It has now reached a critical technical area where the weekly demand zone aligns with the lower boundary of the broader bullish structure.
This confluence makes the current region an important area to monitor, especially as a developing bullish divergence may serve as an early indication that bearish momentum is beginning to weaken.
⭕The first bullish confirmation would come from a break above the orange descending channel and the first trigger area around 1,850, which could signal the beginning of a stronger recovery.
⭕For buyers to regain full control of the long-term trend, price would need to break above the second trigger area around 2,500, confirming a continuation of the broader bullish structure.
The reaction from this area may determine whether the year-long correction is approaching its end, or if the market requires more time before the next bullish expansion can begin.
⚠️Disclaimer: This analysis reflects my personal market view and is not financial advice.
Rayan Nasser
#ETH #Ethereum #Crypto #TechnicalAnalysis #PriceAction #Trading #MarketStructure #CryptoTrading
Over the past year, price has been moving through a corrective phase inside the orange descending channel. It has now reached a critical technical area where the weekly demand zone aligns with the lower boundary of the broader bullish structure.
This confluence makes the current region an important area to monitor, especially as a developing bullish divergence may serve as an early indication that bearish momentum is beginning to weaken.
⭕The first bullish confirmation would come from a break above the orange descending channel and the first trigger area around 1,850, which could signal the beginning of a stronger recovery.
⭕For buyers to regain full control of the long-term trend, price would need to break above the second trigger area around 2,500, confirming a continuation of the broader bullish structure.
The reaction from this area may determine whether the year-long correction is approaching its end, or if the market requires more time before the next bullish expansion can begin.
⚠️Disclaimer: This analysis reflects my personal market view and is not financial advice.
Rayan Nasser
#ETH #Ethereum #Crypto #TechnicalAnalysis #PriceAction #Trading #MarketStructure #CryptoTrading

Wyłączenie odpowiedzialności
Informacje i publikacje nie stanowią i nie powinny być traktowane jako porady finansowe, inwestycyjne, tradingowe ani jakiekolwiek inne rekomendacje dostarczane lub zatwierdzone przez TradingView. Więcej informacji znajduje się w Warunkach użytkowania.
Wyłączenie odpowiedzialności
Informacje i publikacje nie stanowią i nie powinny być traktowane jako porady finansowe, inwestycyjne, tradingowe ani jakiekolwiek inne rekomendacje dostarczane lub zatwierdzone przez TradingView. Więcej informacji znajduje się w Warunkach użytkowania.