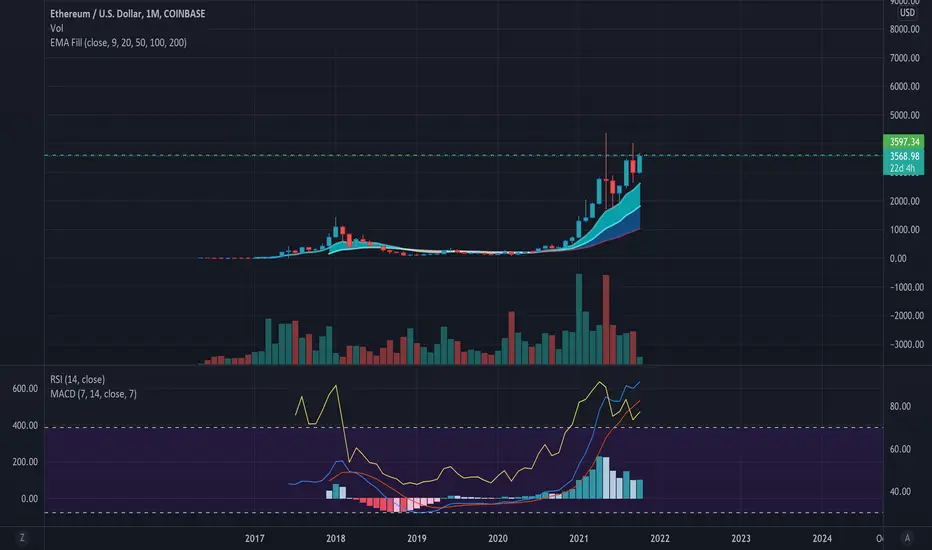
If you have a professional looking chart with plenty of fancy indicators, and yet nothing is making sense, you reached Analysis Paralysis; the rabbit hole that sucks everyone in by the gravity that every Indicator is important. In essence, they all are. The remedy to the mental confusion is to find the few that give you the best visual quality to make trading simpler. Strip the Charts back to its basics using only a handful of indicators.
The ETH chart provided uses MACD, RSI, Volume, and Script. The combination provides clear visualization of momentum, support & resistance zones and liquidity; key factors Traders need to create a trading strategy.
Majority of profitable Traders advocate the adage "Less is more!" I found this to be true in my experience.
The
ETH chart provided uses MACD, RSI, Volume, and Script. The combination provides clear visualization of momentum, support & resistance zones and liquidity; key factors Traders need to create a trading strategy. Majority of profitable Traders advocate the adage "Less is more!" I found this to be true in my experience.

Wyłączenie odpowiedzialności
Informacje i publikacje nie stanowią i nie powinny być traktowane jako porady finansowe, inwestycyjne, tradingowe ani jakiekolwiek inne rekomendacje dostarczane lub zatwierdzone przez TradingView. Więcej informacji znajduje się w Warunkach użytkowania.
Wyłączenie odpowiedzialności
Informacje i publikacje nie stanowią i nie powinny być traktowane jako porady finansowe, inwestycyjne, tradingowe ani jakiekolwiek inne rekomendacje dostarczane lub zatwierdzone przez TradingView. Więcej informacji znajduje się w Warunkach użytkowania.