
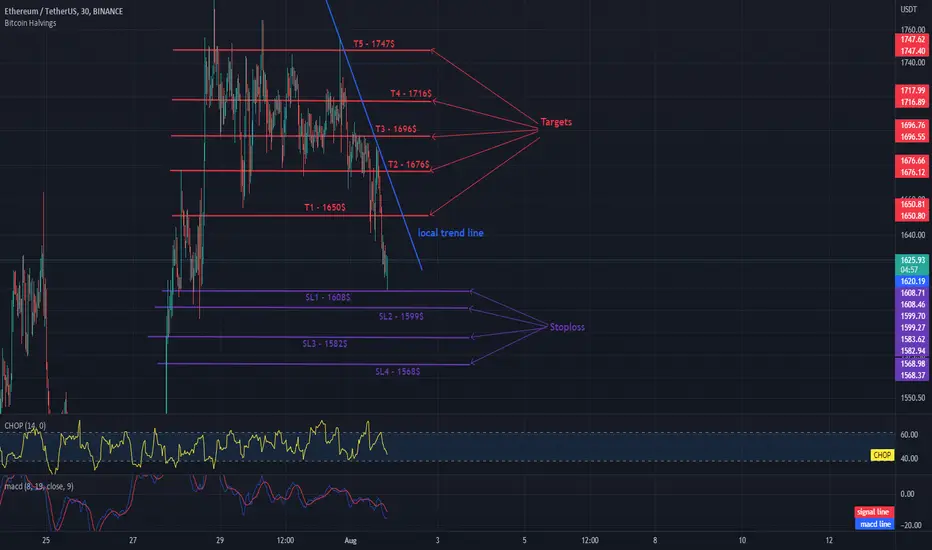
Hello everyone, let's take a look at the 30M ETH to USDT chart as you can see the price is moving below the local downtrend line.
Let's start by setting goals for the near future that we can consider:
T1 - $ 1,650
T2 - $ 1,676
T3 - $ 1,696
T4 - $ 1716
and
T5 - $ 1,747
Now let's move on to the stop loss in case of further market declines:
SL1 - $ 1608
SL2 - $ 1,599
SL3 - $ 1,582
and
SL4 - $ 1568
Looking at the CHOP indicator, we can see that in the 30-minute interval most of the energy has been used, and the MACD indicator shows that we are in the local downtrend.

Wyłączenie odpowiedzialności
Informacje i publikacje nie stanowią i nie powinny być traktowane jako porady finansowe, inwestycyjne, tradingowe ani jakiekolwiek inne rekomendacje dostarczane lub zatwierdzone przez TradingView. Więcej informacji znajduje się w Warunkach użytkowania.
Wyłączenie odpowiedzialności
Informacje i publikacje nie stanowią i nie powinny być traktowane jako porady finansowe, inwestycyjne, tradingowe ani jakiekolwiek inne rekomendacje dostarczane lub zatwierdzone przez TradingView. Więcej informacji znajduje się w Warunkach użytkowania.