
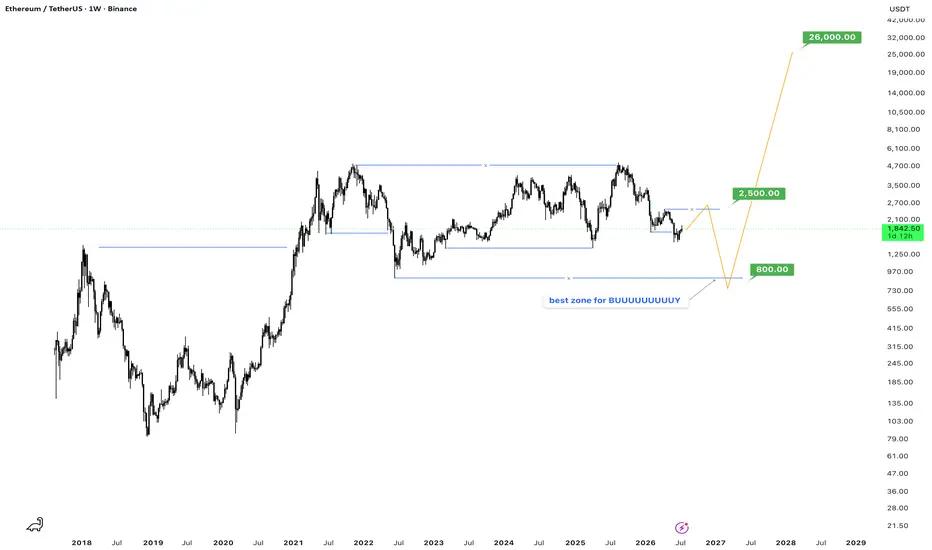
**SMC (Smart Money Concept) Analysis: ETH/USDT Weekly Chart**
**Timeframe:** Weekly (W1)
**Current Price (as of July 18, 2026):** ~$1,841.95
**Chart Outlook:** Macro Bullish with Strong Institutional Accumulation Structure
### Key SMC Elements Identified:
**1. Higher Timeframe Structure**
- ETH has been respecting a clear **Bullish Market Structure** since the 2020-2021 cycle.
- Multiple **Order Blocks (OB)** and **Breaker Blocks** are visible:
- Strong **Bullish Order Block** around $800–$1,000 zone (major demand area from previous cycle).
- Mitigation of previous highs with clean displacement upward.
- The chart shows classic **BOS (Break of Structure)** followed by **CHOCH (Change of Character)** confirmations in the bullish direction.
**2. Liquidity & Displacement**
- Recent price action swept liquidity below recent lows (~$1,800 area) before the strong upward displacement.
- The "best zone for BUUUUUUUUY" highlighted aligns perfectly with a **Premium/Discount array** — deep in the discount relative to the overall macro range.
**3. Key Levels (SMC Framework)**
**Demand Zones (Buy Areas):**
- **Primary Bullish Order Block:** $800 – $970 (Major institutional demand — very strong)
- **Secondary Demand:** $1,200 – $1,500 range (previous consolidation)
- **Current Entry Zone:** $1,700 – $1,950 (where price is currently consolidating)
**Supply Zones (Sell/Take Profit Areas):**
- **Intermediate Target:** $2,500 (noted on chart)
- **Major Liquidity Pool:** $4,700 – $6,100
- **Macro Target:** **$26,000** (aggressive parabolic projection by late 2028)
**4. Fair Value Gap & Imbalances**
- There are multiple unfilled FVGs above current price that price is likely to seek as it moves higher.
- The move from ~$800 to the current levels left significant inefficiency that Smart Money is now filling on the way up.
### Trading Strategy (SMC Style):
**Bias:** Strongly Bullish (Higher Highs + Higher Lows expected)
**Entry Setup:**
- Look for **inducement** below the current range followed by strong bullish confirmation (displacement + FVG fill).
- Optimal entries near the $1,800 – $1,950 zone with confluences (Order Block + Liquidity sweep).
**Risk Management:**
- Stop Loss: Below the most recent low / invalidation of the bullish structure (~$1,600 or lower depending on entry).
- Take Profit Levels:
1. $2,500 (first major liquidity)
2. $4,700 – $6,100
3. Extended Target: $26,000 (macro cycle top)
### Summary:
The chart displays textbook **Smart Money accumulation** behavior. Ethereum is currently in a deep discount zone after sweeping liquidity, positioning for the next major impulsive leg higher. The $800–$1,000 area remains one of the strongest demand zones on the chart.
**"Best zone for BUUUUUUUUY"** — exactly where Smart Money has been defending and loading.
---
**Timeframe:** Weekly (W1)
**Current Price (as of July 18, 2026):** ~$1,841.95
**Chart Outlook:** Macro Bullish with Strong Institutional Accumulation Structure
### Key SMC Elements Identified:
**1. Higher Timeframe Structure**
- ETH has been respecting a clear **Bullish Market Structure** since the 2020-2021 cycle.
- Multiple **Order Blocks (OB)** and **Breaker Blocks** are visible:
- Strong **Bullish Order Block** around $800–$1,000 zone (major demand area from previous cycle).
- Mitigation of previous highs with clean displacement upward.
- The chart shows classic **BOS (Break of Structure)** followed by **CHOCH (Change of Character)** confirmations in the bullish direction.
**2. Liquidity & Displacement**
- Recent price action swept liquidity below recent lows (~$1,800 area) before the strong upward displacement.
- The "best zone for BUUUUUUUUY" highlighted aligns perfectly with a **Premium/Discount array** — deep in the discount relative to the overall macro range.
**3. Key Levels (SMC Framework)**
**Demand Zones (Buy Areas):**
- **Primary Bullish Order Block:** $800 – $970 (Major institutional demand — very strong)
- **Secondary Demand:** $1,200 – $1,500 range (previous consolidation)
- **Current Entry Zone:** $1,700 – $1,950 (where price is currently consolidating)
**Supply Zones (Sell/Take Profit Areas):**
- **Intermediate Target:** $2,500 (noted on chart)
- **Major Liquidity Pool:** $4,700 – $6,100
- **Macro Target:** **$26,000** (aggressive parabolic projection by late 2028)
**4. Fair Value Gap & Imbalances**
- There are multiple unfilled FVGs above current price that price is likely to seek as it moves higher.
- The move from ~$800 to the current levels left significant inefficiency that Smart Money is now filling on the way up.
### Trading Strategy (SMC Style):
**Bias:** Strongly Bullish (Higher Highs + Higher Lows expected)
**Entry Setup:**
- Look for **inducement** below the current range followed by strong bullish confirmation (displacement + FVG fill).
- Optimal entries near the $1,800 – $1,950 zone with confluences (Order Block + Liquidity sweep).
**Risk Management:**
- Stop Loss: Below the most recent low / invalidation of the bullish structure (~$1,600 or lower depending on entry).
- Take Profit Levels:
1. $2,500 (first major liquidity)
2. $4,700 – $6,100
3. Extended Target: $26,000 (macro cycle top)
### Summary:
The chart displays textbook **Smart Money accumulation** behavior. Ethereum is currently in a deep discount zone after sweeping liquidity, positioning for the next major impulsive leg higher. The $800–$1,000 area remains one of the strongest demand zones on the chart.
**"Best zone for BUUUUUUUUY"** — exactly where Smart Money has been defending and loading.
---

Wyłączenie odpowiedzialności
Informacje i publikacje nie stanowią i nie powinny być traktowane jako porady finansowe, inwestycyjne, tradingowe ani jakiekolwiek inne rekomendacje dostarczane lub zatwierdzone przez TradingView. Więcej informacji znajduje się w Warunkach użytkowania.
Wyłączenie odpowiedzialności
Informacje i publikacje nie stanowią i nie powinny być traktowane jako porady finansowe, inwestycyjne, tradingowe ani jakiekolwiek inne rekomendacje dostarczane lub zatwierdzone przez TradingView. Więcej informacji znajduje się w Warunkach użytkowania.