
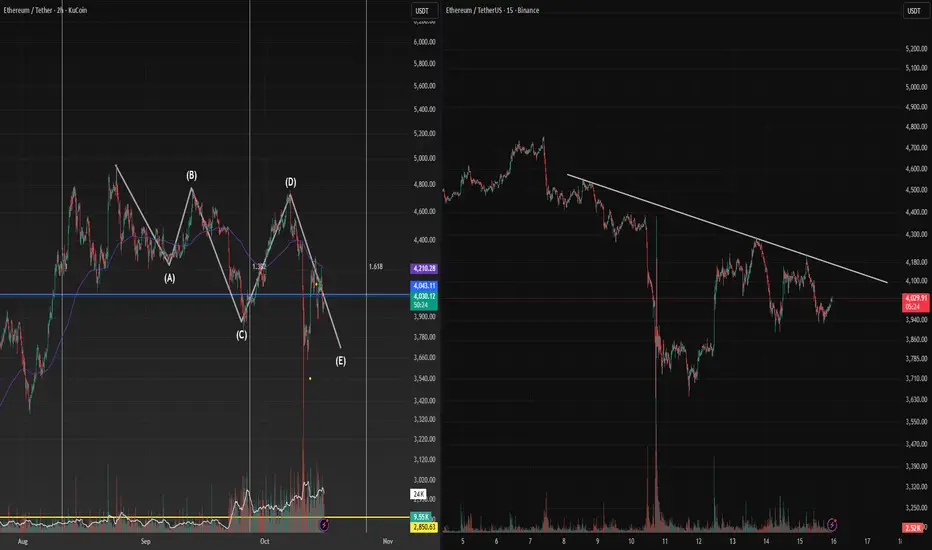
(Left) 2-Hour Chart: ABCDE Descending Triangle
Textbook contracting ABCDE correction for Ethereum/USDT:
A → B → C formed the first three legs of the correction.
D pushed back up into the descending trendline but failed to reclaim structure.
Now, E is the key — this is either:
1. Final flush to complete the triangle, or
2. Failed breakdown, leading to an upside break.
Typical E-wave behavior:
Often weak and lacks momentum (especially compared to A and C).
Sometimes makes a marginal lower low below C, then reverses sharply.
Volume tends to contract during the E-wave, then expand at breakout.
E-wave target zones often line up with
0.618 FIB to 1.0 FIB extension of the C leg.
For the chart on the right, the descending trendline
If price rejects at this line, it’s the clean start of E-wave down (to finish the ABCDE).
If price breaks above this line on strong volume, it invalidates the E-wave flush, likely triggering a triangle breakout early.
What to watch:
Breakout confirmation = strong candle close above $4,180–$4,200 on the 15-min + volume surge.
Breakdown confirmation = failure near the trendline, followed by controlled drift down (E-wave style).
It maybe closer to Friday before we see any sign of breaking out, if the chop continue.
Happy Trading!
Textbook contracting ABCDE correction for Ethereum/USDT:
A → B → C formed the first three legs of the correction.
D pushed back up into the descending trendline but failed to reclaim structure.
Now, E is the key — this is either:
1. Final flush to complete the triangle, or
2. Failed breakdown, leading to an upside break.
Typical E-wave behavior:
Often weak and lacks momentum (especially compared to A and C).
Sometimes makes a marginal lower low below C, then reverses sharply.
Volume tends to contract during the E-wave, then expand at breakout.
E-wave target zones often line up with
0.618 FIB to 1.0 FIB extension of the C leg.
For the chart on the right, the descending trendline
If price rejects at this line, it’s the clean start of E-wave down (to finish the ABCDE).
If price breaks above this line on strong volume, it invalidates the E-wave flush, likely triggering a triangle breakout early.
What to watch:
Breakout confirmation = strong candle close above $4,180–$4,200 on the 15-min + volume surge.
Breakdown confirmation = failure near the trendline, followed by controlled drift down (E-wave style).
It maybe closer to Friday before we see any sign of breaking out, if the chop continue.
Happy Trading!

Wyłączenie odpowiedzialności
Informacje i publikacje nie stanowią i nie powinny być traktowane jako porady finansowe, inwestycyjne, tradingowe ani jakiekolwiek inne rekomendacje dostarczane lub zatwierdzone przez TradingView. Więcej informacji znajduje się w Warunkach użytkowania.
Wyłączenie odpowiedzialności
Informacje i publikacje nie stanowią i nie powinny być traktowane jako porady finansowe, inwestycyjne, tradingowe ani jakiekolwiek inne rekomendacje dostarczane lub zatwierdzone przez TradingView. Więcej informacji znajduje się w Warunkach użytkowania.