

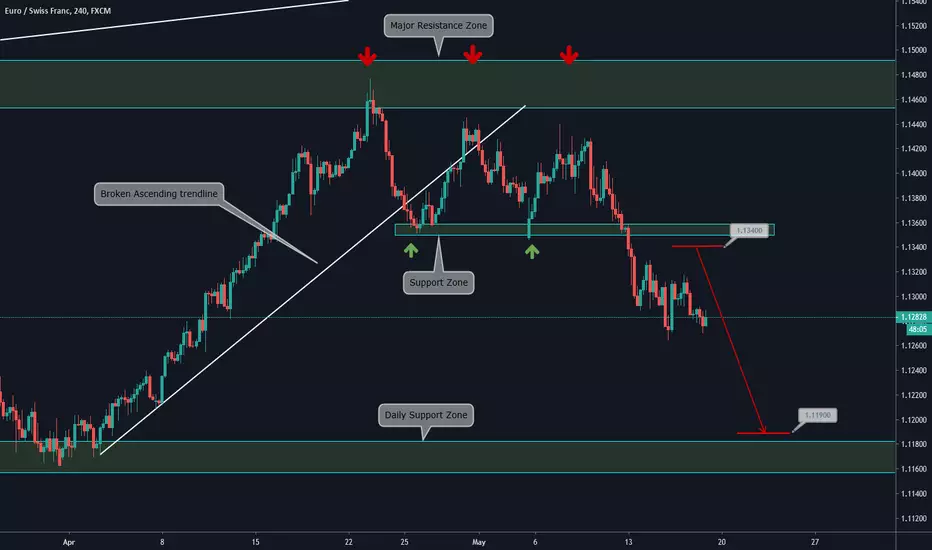
4H CHART EXPLANATION:
Main Items we Observe on the Chart:
-On April 2019 price broke the ascending trend line
-After that, price started a corrective structure
-As we saw on the weekly analysis the price couldn't surpass the resistance zone and made a breakout of the corrective structure, starting a bearish movement
Based on this, as the price breaks out below 1.13400 with close candlesticks we expect a continuation of the descending movement towards 1.11900
Expect corrective structures to be formed on the way to the support zone
MULTI TIMEFRAME VISION:
Weekly:

Daily:

Main Items we Observe on the Chart:
-On April 2019 price broke the ascending trend line
-After that, price started a corrective structure
-As we saw on the weekly analysis the price couldn't surpass the resistance zone and made a breakout of the corrective structure, starting a bearish movement
Based on this, as the price breaks out below 1.13400 with close candlesticks we expect a continuation of the descending movement towards 1.11900
Expect corrective structures to be formed on the way to the support zone
MULTI TIMEFRAME VISION:
Weekly:
Daily:

Wyłączenie odpowiedzialności
Informacje i publikacje nie stanowią i nie powinny być traktowane jako porady finansowe, inwestycyjne, tradingowe ani jakiekolwiek inne rekomendacje dostarczane lub zatwierdzone przez TradingView. Więcej informacji znajduje się w Warunkach użytkowania.
Wyłączenie odpowiedzialności
Informacje i publikacje nie stanowią i nie powinny być traktowane jako porady finansowe, inwestycyjne, tradingowe ani jakiekolwiek inne rekomendacje dostarczane lub zatwierdzone przez TradingView. Więcej informacji znajduje się w Warunkach użytkowania.