

SMC Trading point update
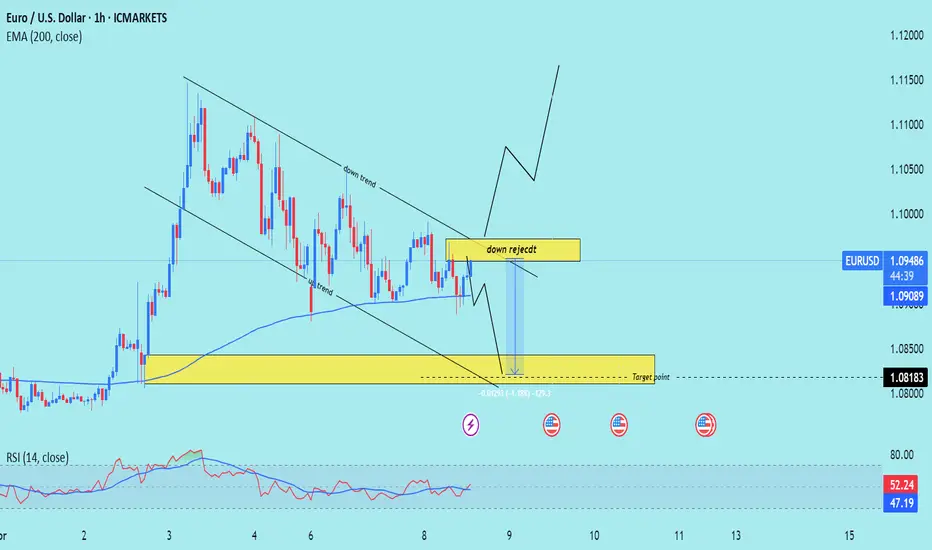
This chart presents a technical analysis of the EUR/USD pair on a 1-hour timeframe. Here's the breakdown and idea behind the analysis:
Chart Analysis Summary:
1. Trend Structure:
The price was in a downtrend, moving within a descending channel.
Recently, the price has rejected the upper boundary of the channel (noted as "down reject").
There's a 200 EMA (Exponential Moving Average) acting as dynamic support around the 1.09086 level.
Mr SMC Trading point
2. Support Zone:
A strong demand zone (highlighted in yellow) is visible near the 1.08183 area.
This zone aligns with previous structure support and a potential reversal point.
3. RSI Indicator:
RSI is around 49, showing a neutral to slightly bearish momentum.
No overbought/oversold signals yet, suggesting room for further downside before a reversal.
4. Projection Idea:
The analyst expects a possible short-term drop into the yellow support zone (target: 1.08183).
After reaching the target, a bullish reversal is anticipated, aiming for a breakout above the downtrend with a rally towards the 1.10500+ zone.
Trading Idea:
Short-Term Bearish Move: Sell toward 1.08183 if price confirms rejection of the trendline or 200 EMA.
Medium-Term Bullish Reversal: Watch for bullish confirmation (e.g., engulfing candle, RSI divergence) at the 1.08183 zone to go long toward higher highs.
Pales support boost 🚀 analysis follow)
This chart presents a technical analysis of the EUR/USD pair on a 1-hour timeframe. Here's the breakdown and idea behind the analysis:
Chart Analysis Summary:
1. Trend Structure:
The price was in a downtrend, moving within a descending channel.
Recently, the price has rejected the upper boundary of the channel (noted as "down reject").
There's a 200 EMA (Exponential Moving Average) acting as dynamic support around the 1.09086 level.
Mr SMC Trading point
2. Support Zone:
A strong demand zone (highlighted in yellow) is visible near the 1.08183 area.
This zone aligns with previous structure support and a potential reversal point.
3. RSI Indicator:
RSI is around 49, showing a neutral to slightly bearish momentum.
No overbought/oversold signals yet, suggesting room for further downside before a reversal.
4. Projection Idea:
The analyst expects a possible short-term drop into the yellow support zone (target: 1.08183).
After reaching the target, a bullish reversal is anticipated, aiming for a breakout above the downtrend with a rally towards the 1.10500+ zone.
Trading Idea:
Short-Term Bearish Move: Sell toward 1.08183 if price confirms rejection of the trendline or 200 EMA.
Medium-Term Bullish Reversal: Watch for bullish confirmation (e.g., engulfing candle, RSI divergence) at the 1.08183 zone to go long toward higher highs.
Pales support boost 🚀 analysis follow)

(Services:✔️ JOIN Telegram channel
t.me/+zmgnHqUTiY8wMTU0
t.me/+zmgnHqUTiY8wMTU0
t.me/+zmgnHqUTiY8wMTU0
Join my recommended broker , link 👇
World best broker exness ✅D
one.exnesstrack.org/a/l1t1rf3p6v
t.me/+zmgnHqUTiY8wMTU0
t.me/+zmgnHqUTiY8wMTU0
t.me/+zmgnHqUTiY8wMTU0
Join my recommended broker , link 👇
World best broker exness ✅D
one.exnesstrack.org/a/l1t1rf3p6v
Powiązane publikacje
Wyłączenie odpowiedzialności
Informacje i publikacje nie stanowią i nie powinny być traktowane jako porady finansowe, inwestycyjne, tradingowe ani jakiekolwiek inne rekomendacje dostarczane lub zatwierdzone przez TradingView. Więcej informacji znajduje się w Warunkach użytkowania.
(Services:✔️ JOIN Telegram channel
t.me/+zmgnHqUTiY8wMTU0
t.me/+zmgnHqUTiY8wMTU0
t.me/+zmgnHqUTiY8wMTU0
Join my recommended broker , link 👇
World best broker exness ✅D
one.exnesstrack.org/a/l1t1rf3p6v
t.me/+zmgnHqUTiY8wMTU0
t.me/+zmgnHqUTiY8wMTU0
t.me/+zmgnHqUTiY8wMTU0
Join my recommended broker , link 👇
World best broker exness ✅D
one.exnesstrack.org/a/l1t1rf3p6v
Powiązane publikacje
Wyłączenie odpowiedzialności
Informacje i publikacje nie stanowią i nie powinny być traktowane jako porady finansowe, inwestycyjne, tradingowe ani jakiekolwiek inne rekomendacje dostarczane lub zatwierdzone przez TradingView. Więcej informacji znajduje się w Warunkach użytkowania.