

Now, let's see what we have on EUR/USD.
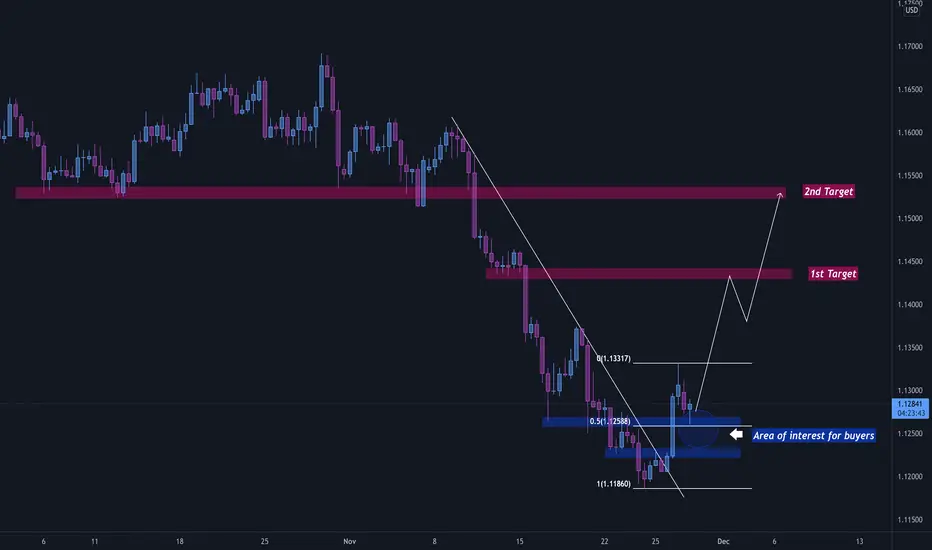
As it can be clearly inferred from the chart analysis, a really strong bullish candle was printed last week, which penetrated the previous Lower Low on the H4 and H8 timeframe charts. Looking at the DAILY and WEEKLY charts, we can see that the price has been dropping like a needle and some corrections are definitely needed. Although the long-term trend is bearish, we believe that the price will continue rising for some time.
The price is currently sitting on a zone of previous resistance turned support which aligns with 50% Fibonacci retracement level. We are waiting for some action and confirmations around this zone, before we open longs positions and aim for the targets identified on the chart
As it can be clearly inferred from the chart analysis, a really strong bullish candle was printed last week, which penetrated the previous Lower Low on the H4 and H8 timeframe charts. Looking at the DAILY and WEEKLY charts, we can see that the price has been dropping like a needle and some corrections are definitely needed. Although the long-term trend is bearish, we believe that the price will continue rising for some time.
The price is currently sitting on a zone of previous resistance turned support which aligns with 50% Fibonacci retracement level. We are waiting for some action and confirmations around this zone, before we open longs positions and aim for the targets identified on the chart

Wyłączenie odpowiedzialności
Informacje i publikacje nie stanowią i nie powinny być traktowane jako porady finansowe, inwestycyjne, tradingowe ani jakiekolwiek inne rekomendacje dostarczane lub zatwierdzone przez TradingView. Więcej informacji znajduje się w Warunkach użytkowania.
Wyłączenie odpowiedzialności
Informacje i publikacje nie stanowią i nie powinny być traktowane jako porady finansowe, inwestycyjne, tradingowe ani jakiekolwiek inne rekomendacje dostarczane lub zatwierdzone przez TradingView. Więcej informacji znajduje się w Warunkach użytkowania.